
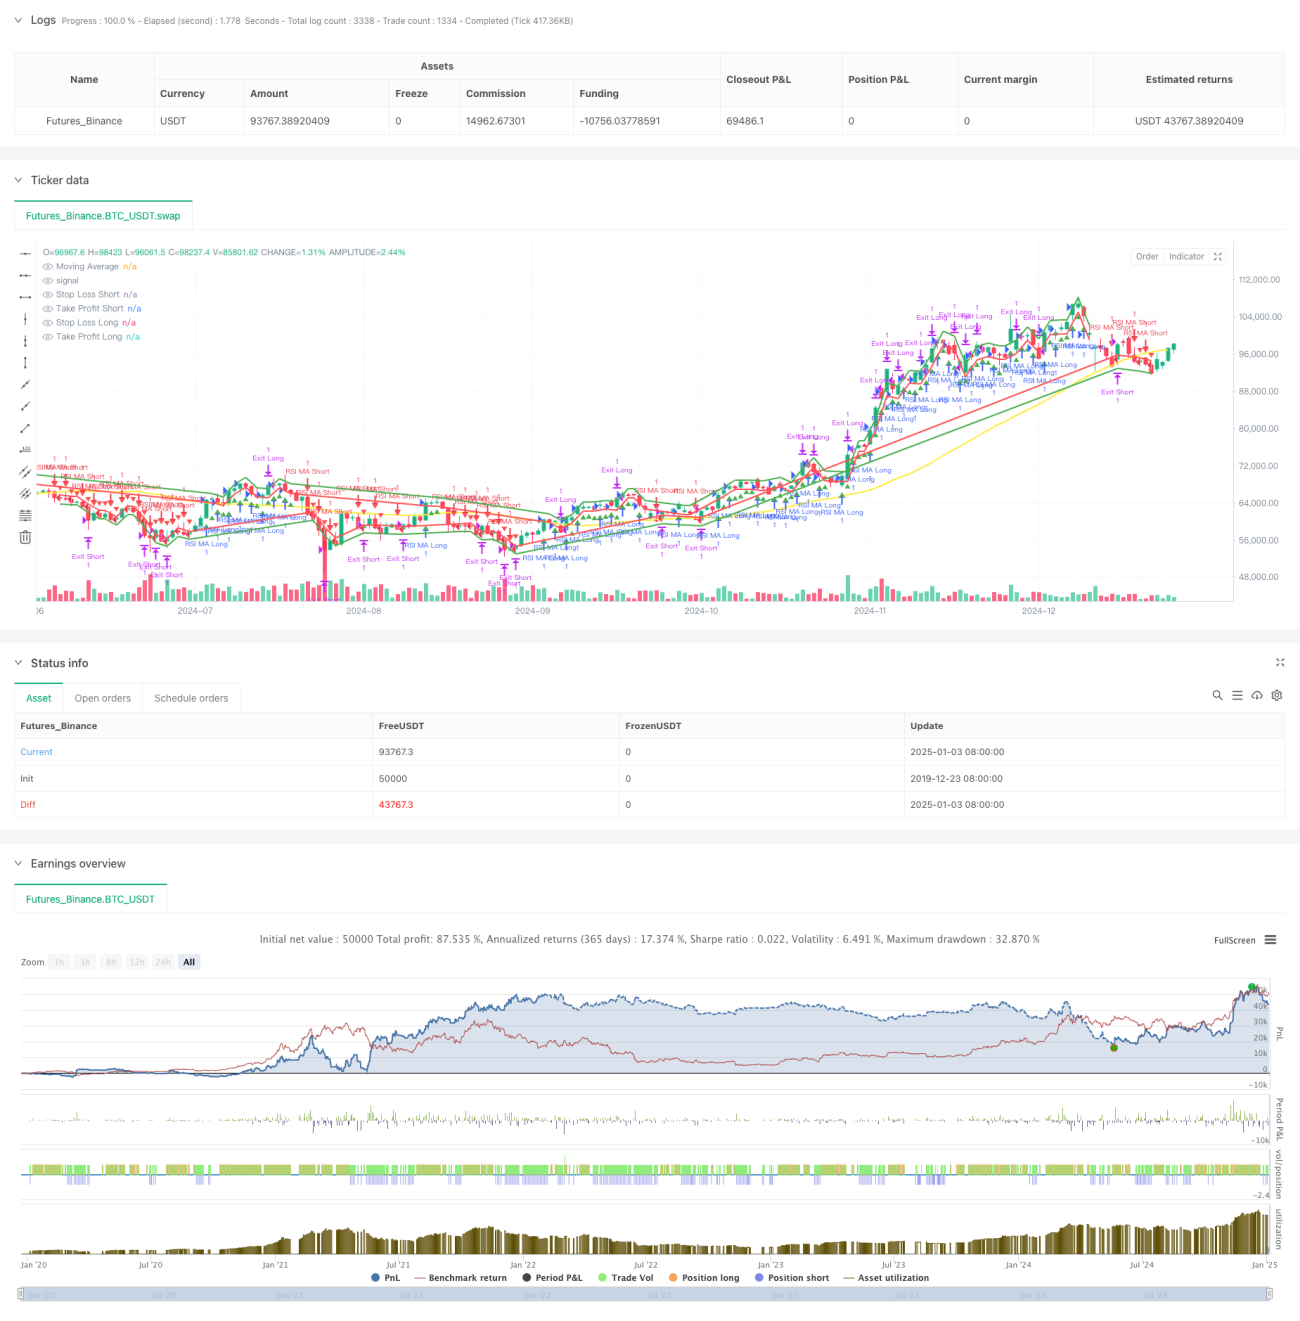
この戦略は、相対力指数 (RSI) と単純移動平均 (SMA) を組み合わせたトレンド追跡取引システムです。この戦略では、移動平均を使用して市場トレンドの方向を決定し、RSI インジケーターを使用して勢いを確認して、トレンドと勢いが共鳴したときに取引を行います。この戦略では、リスクを効果的に制御できる完全なストッププロフィットおよびストップロスメカニズムを設計しました。
この戦略のコアロジックは、2 つのテクニカル指標を組み合わせて使用することに基づいています。
取引シグナル生成ロジック:
リスク管理では、それぞれエントリー価格の固定パーセンテージとして設定されるパーセンテージ ストップ ロスとテイク プロフィットの方法が使用されます。
この戦略は、トレンドとモメンタム指標を組み合わせて、明確なロジックと制御可能なリスクを備えた取引システムを構築します。固有のリスクはあるものの、この戦略は合理的なパラメータ設定とリスク管理を通じて優れた実用性を示しています。その後の最適化の方向性は、主に動的パラメータの調整、市場環境の特定、信号品質の改善に重点が置かれ、これにより戦略の安定性と収益性がさらに向上することが期待されます。
/*backtest
start: 2019-12-23 08:00:00
end: 2025-01-04 08:00:00
period: 1d
basePeriod: 1d
exchanges: [{"eid":"Futures_Binance","currency":"BTC_USDT"}]
*/
// This Pine Script™ code is subject to the terms of the Mozilla Public License 2.0 at https://mozilla.org/MPL/2.0/
// © raiford87
//@version=6
strategy("RSI + MA Trend Strategy (v6)",
shorttitle="RSI_MA_Trend_v6",
overlay=true,
initial_capital=50000,
default_qty_type=strategy.fixed,
default_qty_value=1)
// ─────────────────────────────────────────────────────────────────────────────────────
// 1. USER INPUTS
// ─────────────────────────────────────────────────────────────────────────────────────
maLength = input.int(50, "Moving Average Length")
rsiLength = input.int(14, "RSI Length")
rsiBuyLevel = input.int(55, "RSI > X for Buy", minval=1, maxval=99)
rsiSellLevel = input.int(45, "RSI < X for Sell", minval=1, maxval=99)
stopLossPerc = input.float(1.0, "Stop Loss %", minval=0.1)
takeProfitPerc = input.float(2.0, "Take Profit %", minval=0.1)
// ─────────────────────────────────────────────────────────────────────────────────────
// 2. INDICATOR CALCULATIONS
// ─────────────────────────────────────────────────────────────────────────────────────
maValue = ta.sma(close, maLength)
rsiVal = ta.rsi(close, rsiLength)
// Trend conditions
bullTrend = close > maValue
bearTrend = close < maValue
// RSI conditions
rsiBull = rsiVal > rsiBuyLevel
rsiBear = rsiVal < rsiSellLevel
// ─────────────────────────────────────────────────────────────────────────────────────
// 3. ENTRY CONDITIONS
// ─────────────────────────────────────────────────────────────────────────────────────
longCondition = bullTrend and rsiBull
shortCondition = bearTrend and rsiBear
if longCondition
strategy.entry("RSI MA Long", strategy.long)
if shortCondition
strategy.entry("RSI MA Short", strategy.short)
// ─────────────────────────────────────────────────────────────────────────────────────
// 4. STOP LOSS & TAKE PROFIT
// ─────────────────────────────────────────────────────────────────────────────────────
stopLossLevel = stopLossPerc * 0.01
takeProfitLevel = takeProfitPerc * 0.01
if strategy.position_size > 0
stopPriceLong = strategy.position_avg_price * (1 - stopLossLevel)
tpPriceLong = strategy.position_avg_price * (1 + takeProfitLevel)
strategy.exit("Exit Long", from_entry="RSI MA Long", stop=stopPriceLong, limit=tpPriceLong)
if strategy.position_size < 0
stopPriceShort = strategy.position_avg_price * (1 + stopLossLevel)
tpPriceShort = strategy.position_avg_price * (1 - takeProfitLevel)
strategy.exit("Exit Short", from_entry="RSI MA Short", stop=stopPriceShort, limit=tpPriceShort)
// ─────────────────────────────────────────────────────────────────────────────────────
// 5. PLOT SIGNALS & LEVELS
// ─────────────────────────────────────────────────────────────────────────────────────
plot(maValue, color=color.yellow, linewidth=2, title="Moving Average")
plotchar(longCondition, title="Long Signal", char='▲', location=location.belowbar, color=color.green, size=size.tiny)
plotchar(shortCondition, title="Short Signal", char='▼', location=location.abovebar, color=color.red, size=size.tiny)
// Plot Stop & TP lines
posIsLong = strategy.position_size > 0
posIsShort = strategy.position_size < 0
plotStopLong = posIsLong ? strategy.position_avg_price * (1 - stopLossLevel) : na
plotTpLong = posIsLong ? strategy.position_avg_price * (1 + takeProfitLevel): na
plotStopShort= posIsShort? strategy.position_avg_price * (1 + stopLossLevel) : na
plotTpShort = posIsShort? strategy.position_avg_price * (1 - takeProfitLevel): na
plot(plotStopLong, color=color.red, linewidth=2, style=plot.style_line, title="Stop Loss Long")
plot(plotTpLong, color=color.green, linewidth=2, style=plot.style_line, title="Take Profit Long")
plot(plotStopShort, color=color.red, linewidth=2, style=plot.style_line, title="Stop Loss Short")
plot(plotTpShort, color=color.green, linewidth=2, style=plot.style_line, title="Take Profit Short")