強化されたトレンドマルチシグナルダイナミックトレーディング戦略

1
Follow
1780
Followers
概要
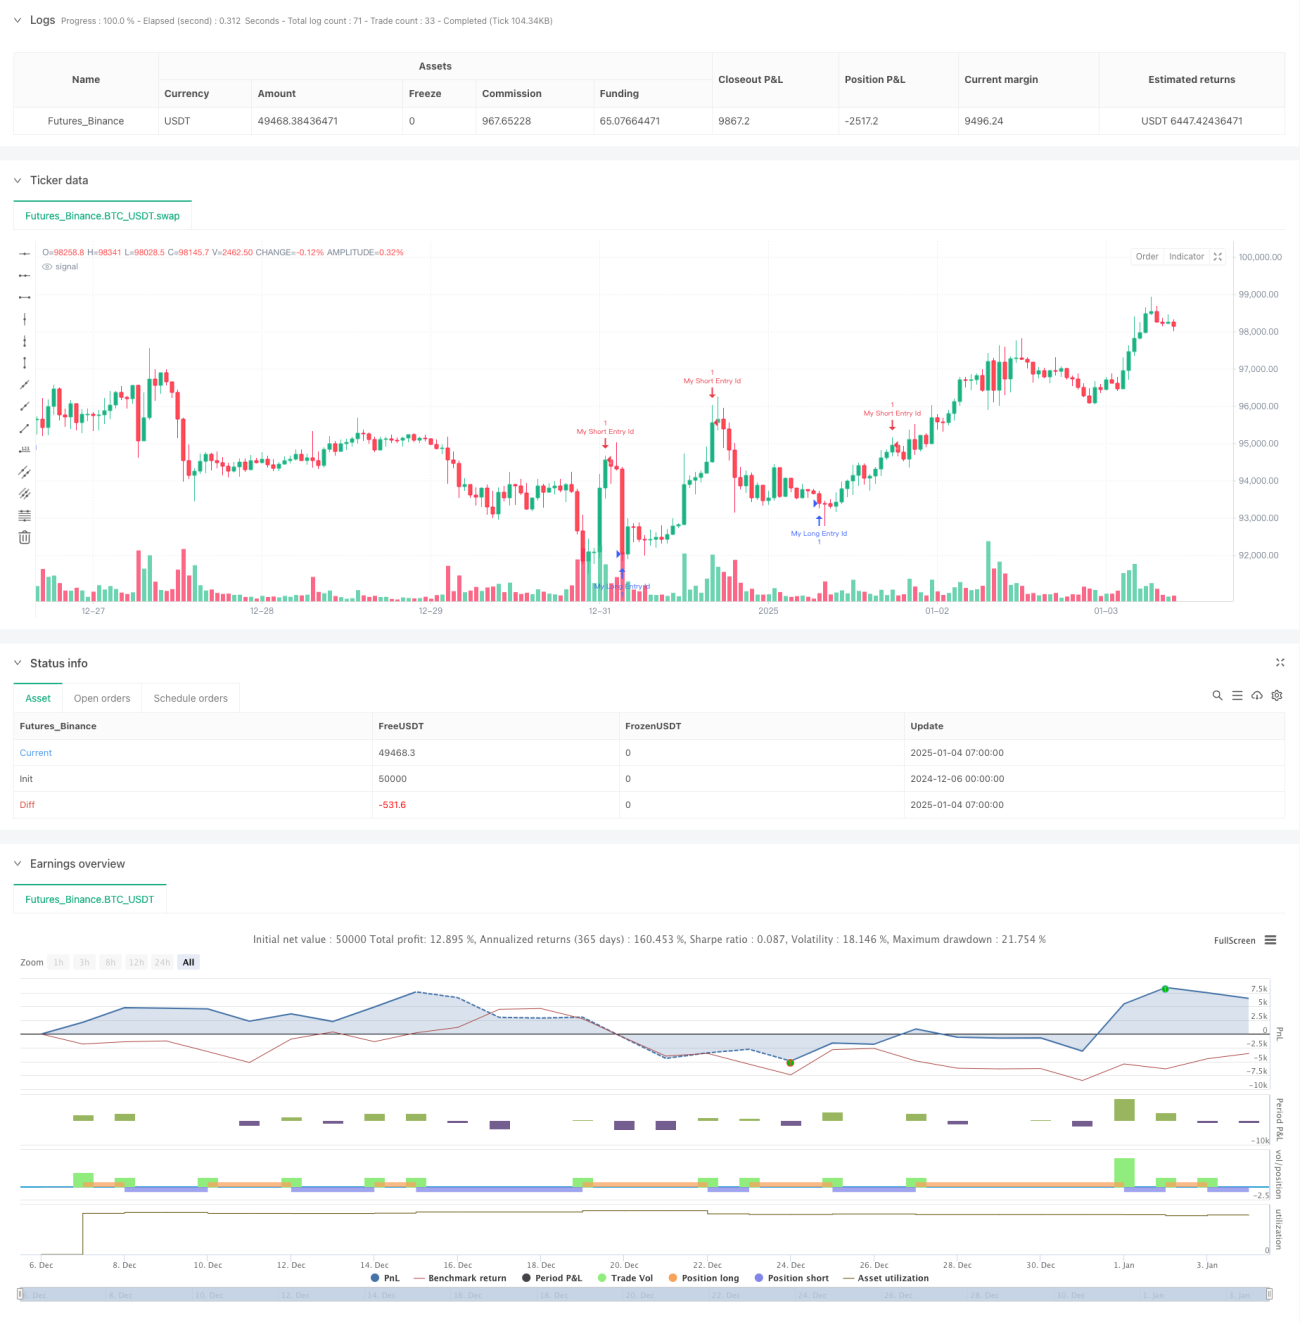
この戦略は、複数のシグナル確認メカニズムと動的なポジション管理を組み合わせた、スーパートレンドインジケーターに基づく高度なトレンド追跡取引システムです。この戦略の核となるのは、ATR (平均真の範囲) を通じてスーパートレンド ラインを計算し、価格トレンドと保有時間ウィンドウを組み合わせて取引シグナルを生成し、市場トレンドをインテリジェントに捉えることです。
戦略原則
この戦略では、3 層の信号フィルタリング メカニズムを使用します。
- 基本的なトレンドの決定: スーパートレンドインジケーター(パラメータ: ATR期間10、係数3.0)を使用して、主なトレンドの方向を特定します。
- 方向確認システム:方向変数を通じてトレンドの変化を追跡し、トレンドが変わったときに取引シグナルを生成します。
- シグナル強化メカニズム: 基本的なエントリーシグナル後 15 ~ 19 サイクル以内に、3 つの連続した K ラインのトレンドによってトレンドの信頼性が確認されます。
資本管理の面では、この戦略では、口座残高の 15% を単一の取引量として使用します。この保守的なポジション管理は、リスク管理に役立ちます。
戦略的優位性
- 複数のシグナルの確認:スーパートレンドインジケーターと価格行動分析を組み合わせることで、誤ったシグナルが大幅に減少します。
- 動的ポジション制御: 過剰取引を回避するための時間ウィンドウに基づくシグナル確認メカニズム
- 完璧なリスク管理: パーセンテージポジション戦略を採用して、各取引のリスクエクスポージャーを効果的に制御します。
- 強力なトレンド適応性:この戦略は、さまざまな市場環境に合わせて適応的に調整できるため、利益の安定性が向上します。
戦略リスク
- トレンド反転リスク: 不安定な市場では誤ったシグナルが発生し、継続的なストップロスにつながる可能性があります。
- パラメータ感度: ATR期間とファクター設定は戦略パフォーマンスに大きな影響を与えます。
- スリッページの影響: 市場の流動性が不十分な場合、大きなスリッページが発生する可能性があります。
- シグナルラグ: 複数の確認メカニズムにより、エントリータイミングに若干の遅れが生じる可能性があります。
戦略最適化の方向性
- ボラティリティフィルタリングの導入: ボラティリティが高い期間に取引パラメータを調整するために、ATR標準偏差インジケーターを追加することをお勧めします。
- シグナル確認メカニズムの最適化:シグナルの信頼性を向上させるために、取引量を補助指標として導入することを検討する
- ストップロスメカニズムの改善:利益をより確実に確保するために、トレーリングストップロス機能を追加することをお勧めします。
- 市場環境分類: 市場環境識別モジュールを追加し、さまざまな市場状況でさまざまなパラメータの組み合わせを使用できます。
要約する
これは完全な構造と厳密なロジックを備えたトレンド追跡戦略であり、複数のシグナル確認メカニズムと完全なリスク管理システムを通じて優れた実用価値を備えています。この戦略は拡張性が高く、推奨される最適化の方向性を通じてその安定性と収益性をさらに向上させることができます。
Source
Pine
Strategy parameters
Related strategies
Comment
All comments (0)
No data
- 1