複数の移動平均クロスオーバーとカマリラのサポートおよびレジスタンストレンド取引システムを組み合わせたもの

EMA CPR SR
作成日: 2025-01-06 11:13:31 最終変更日: 2025-01-06 11:13:31
コピー: 0 クリック数: 373
1
フォロー
1617
フォロワー

複数の移動平均クロスオーバーとカマリラのサポートおよびレジスタンストレンド取引システムを組み合わせたもの

概要

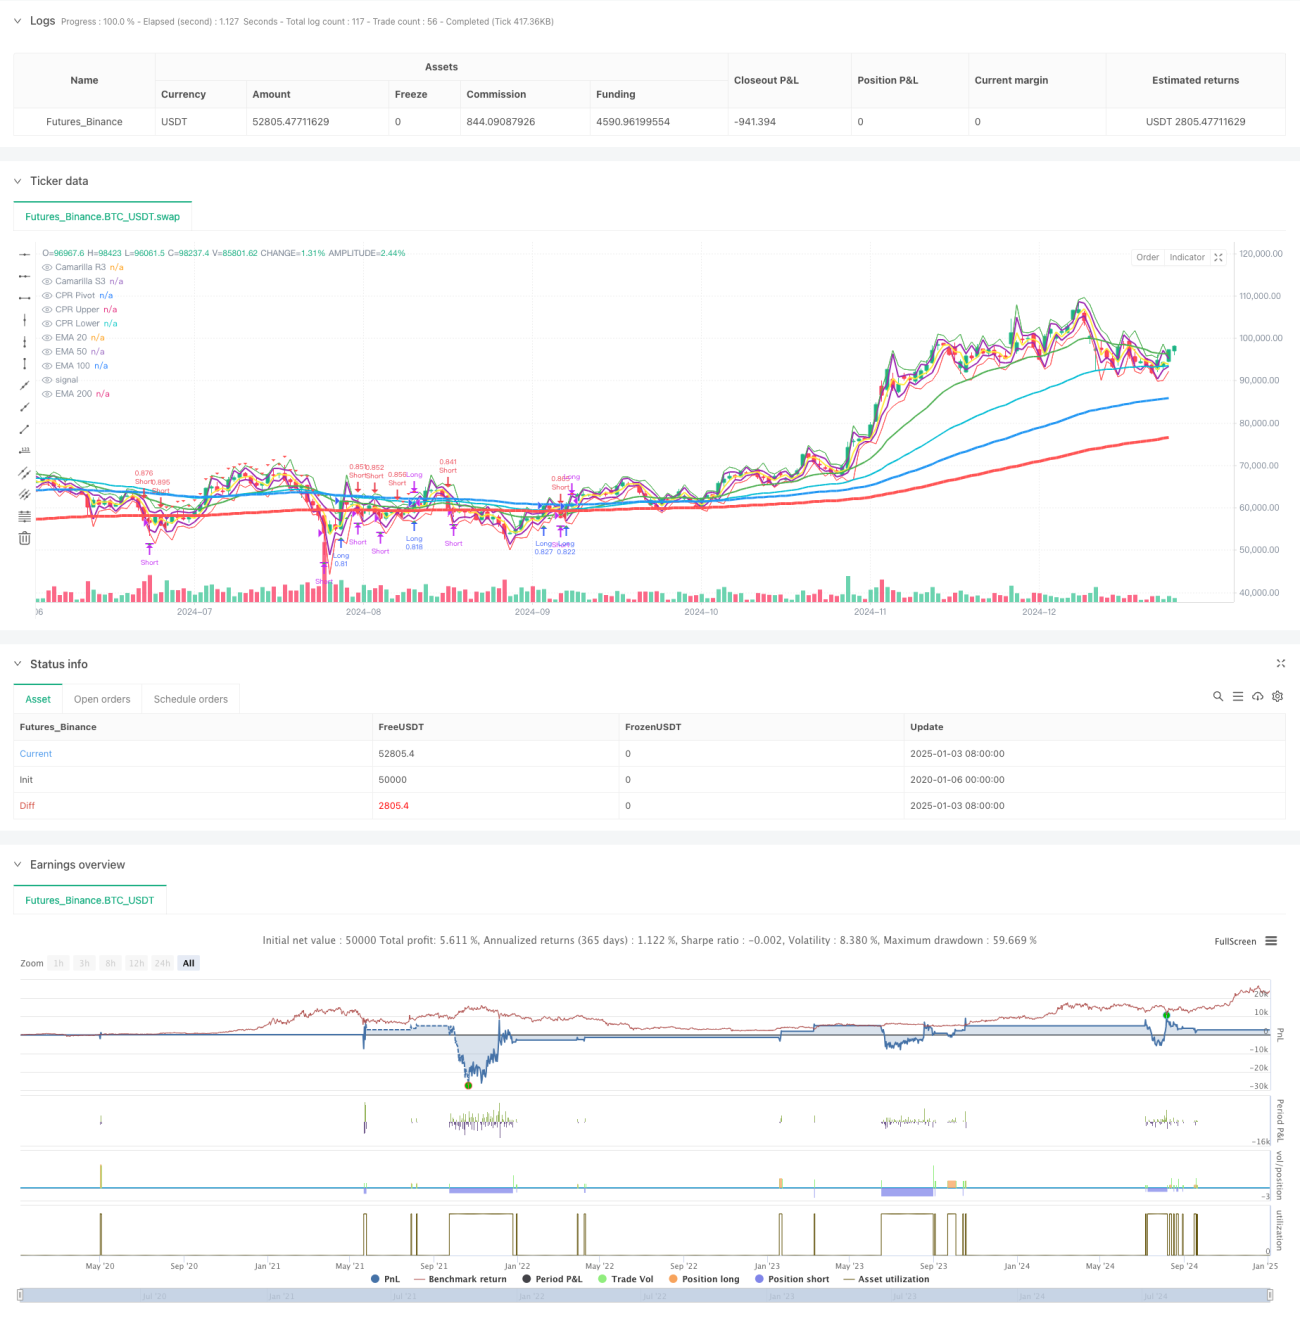
この戦略は、複数の指数移動平均 (EMA)、カマリラのサポート レベルとレジスタンス レベル、および中央ピボタル レンジ (CPR) を組み合わせたトレンド フォロー トレーディング システムです。この戦略は、複数の移動平均と重要な価格帯に関連して価格を分析することにより、市場の動向と潜在的な取引機会を特定します。このシステムは、ポジションサイズの割合や多様な出口メカニズムなど、厳格な資金管理とリスク管理措置を採用しています。

戦略原則

この戦略は、次のコアコンポーネントに基づいています。

  1. 複数の移動平均システム(EMA20/50/100/200)を使用して、トレンドの方向と強さを確認します。
  2. カマリラのサポートとレジスタンスレベル(R3 / S3)は、主要な価格レベルを識別するために使用されます。
  3. 中心価格範囲 (CPR) は、日中の取引範囲を決定するために使用されます。
  4. エントリーシグナルは、価格がEMA200と交差し、EMA20で確認されることに基づいています。
  5. 出口戦略には固定ポイントとパーセンテージ移動モードが含まれる
  6. ファンド管理システムは口座サイズに応じてポジションサイズを動的に調整します

戦略的優位性

  1. 多次元テクニカル指標の組み合わせにより、より信頼性の高い取引シグナルが提供されます。
  2. さまざまな市場環境に適応する柔軟な出口メカニズム
  3. 完璧な資金管理システムがリスクを効果的に管理
  4. トレンドフォロー機能は大きな動きを捉えるのに役立ちます
  5. 視覚化コンポーネントにより、トレーダーは市場構造を理解しやすくなります。

戦略リスク

  1. 不安定な市場では誤ったシグナルが発生する可能性がある
  2. 複数の指標により取引シグナルが遅れる可能性がある
  3. 固定された出口ポイントは不安定な市場ではうまく機能しない可能性がある
  4. ドローダウンに耐えるためにはより大きな基金規模が必要
  5. 取引コストは戦略全体のリターンに影響を与える可能性がある

戦略最適化の方向性

  1. エントリーとエグジットのパラメータを動的に調整するためのボラティリティ指標を導入する
  2. さまざまな市場環境に適応するために市場状況認識モジュールを追加します
  3. 資金管理システムを最適化し、動的なポジション管理を追加する
  4. シグナル品質を向上させるために取引時間フィルターを追加しました
  5. 信号の信頼性を高めるためにボリューム分析を追加することを検討してください

要約する

この戦略は、複数の古典的なテクニカル分析ツールを統合することで完全な取引システムを構築します。このシステムの利点は、多次元の市場分析と厳格なリスク管理にありますが、さまざまな市場環境への適応性にも注意を払う必要があります。この戦略は、継続的な最適化と改善を通じて、安定性を維持しながら収益性を向上させることが期待されます。

ストラテジーソースコード
/*backtest
start: 2020-01-06 00:00:00
end: 2025-01-04 08:00:00
period: 1d
basePeriod: 1d
exchanges: [{"eid":"Futures_Binance","currency":"BTC_USDT"}]
*/

//@version=5
strategy("Pradeep Crude oil Entry and Exit", overlay=true)

// Input settings for EMAs
ema20_period = input.int(20, title="EMA 20 Period")
ema50_period = input.int(50, title="EMA 50 Period")
ema100_period = input.int(100, title="EMA 100 Period")
ema200_period = input.int(200, title="EMA 200 Period")

// Fixed line width settings for EMAs
ema20_width = 2  // EMA 20 Line Width
ema50_width = 2  // EMA 50 Line Width
ema100_width = 3 // EMA 100 Line Width
ema200_width = 4 // EMA 200 Line Width

// Backtesting inputs
initial_capital = input.float(50000, title="Initial Capital", minval=100)
position_size_percent = input.float(100, title="Position Size (% of Capital)", minval=0.1, maxval=100)
exit_mode = input.string("Price Movement", title="Exit Mode", options=["Price Movement", "Percentage Movement"])
exit_points = input.int(20, title="Exit After X Points", minval=1)
exit_percentage = input.float(1.0, title="Exit After X% Movement", minval=0.1, step=0.1)

// Calculate EMAs
ema20 = ta.ema(close, ema20_period)
ema50 = ta.ema(close, ema50_period)
ema100 = ta.ema(close, ema100_period)
ema200 = ta.ema(close, ema200_period)

// Signal conditions
long_entry_condition = close > ema200 and close > ema20 and close[1] <= ema200
long_exit_condition = (exit_mode == "Price Movement" and close - strategy.position_avg_price >= exit_points * syminfo.mintick) or 
                      (exit_mode == "Percentage Movement" and (close - strategy.position_avg_price) / strategy.position_avg_price * 100 >= exit_percentage)
short_entry_condition = close < ema200 and close < ema20 and close[1] >= ema200
short_exit_condition = (exit_mode == "Price Movement" and strategy.position_avg_price - close >= exit_points * syminfo.mintick) or 
                       (exit_mode == "Percentage Movement" and (strategy.position_avg_price - close) / strategy.position_avg_price * 100 >= exit_percentage)

// Plot EMAs with specified line widths
plot(ema20, color=color.green, title="EMA 20", linewidth=ema20_width)
plot(ema50, color=color.aqua, title="EMA 50", linewidth=ema50_width)
plot(ema100, color=color.blue, title="EMA 100", linewidth=ema100_width)
plot(ema200, color=color.red, title="EMA 200", linewidth=ema200_width)

// Camarilla Pivot Calculation
prev_high = request.security(syminfo.tickerid, "D", high[1])
prev_low = request.security(syminfo.tickerid, "D", low[1])
prev_close = request.security(syminfo.tickerid, "D", close[1])

R3 = prev_close + (prev_high - prev_low) * 1.1 / 2
S3 = prev_close - (prev_high - prev_low) * 1.1 / 2

// Central Pivot Range (CPR) Calculation
pivot = (prev_high + prev_low + prev_close) / 3
upper_cpr = pivot + (prev_high - prev_low)
lower_cpr = pivot - (prev_high - prev_low)

// Plot Camarilla R3, S3 and CPR levels
plot(R3, color=color.purple, title="Camarilla R3", linewidth=2)
plot(S3, color=color.purple, title="Camarilla S3", linewidth=2)
plot(pivot, color=color.yellow, title="CPR Pivot", linewidth=2)
plot(upper_cpr, color=color.green, title="CPR Upper", linewidth=1)
plot(lower_cpr, color=color.red, title="CPR Lower", linewidth=1)

// Backtesting: Capital and position size
capital = initial_capital
risk_per_trade = (position_size_percent / 100) * capital

// Long positions
if long_entry_condition
    strategy.entry("Long", strategy.long, qty=risk_per_trade / close)
    // Display entry price label
    label.new(bar_index, close, text="Entry: " + str.tostring(close), color=color.green, style=label.style_label_up, yloc=yloc.belowbar)

if long_exit_condition
    strategy.close("Long")
    // Display exit price label
    label.new(bar_index, close, text="Exit: " + str.tostring(close), color=color.red, style=label.style_label_down, yloc=yloc.abovebar)

// Short positions
if short_entry_condition
    strategy.entry("Short", strategy.short, qty=risk_per_trade / close)
    // Display entry price label
    label.new(bar_index, close, text="Entry: " + str.tostring(close), color=color.red, style=label.style_label_down, yloc=yloc.abovebar)

if short_exit_condition
    strategy.close("Short")
    // Display exit price label
    label.new(bar_index, close, text="Exit: " + str.tostring(close), color=color.green, style=label.style_label_up, yloc=yloc.belowbar)

// Plot signals
plotshape(long_entry_condition, style=shape.triangleup, location=location.belowbar, color=color.new(color.green, 0), size=size.small, title="Long Entry")
plotshape(long_exit_condition, style=shape.triangledown, location=location.abovebar, color=color.new(color.red, 0), size=size.small, title="Long Exit")
plotshape(short_entry_condition, style=shape.triangledown, location=location.abovebar, color=color.new(color.red, 0), size=size.small, title="Short Entry")
plotshape(short_exit_condition, style=shape.triangleup, location=location.belowbar, color=color.new(color.green, 0), size=size.small, title="Short Exit")