複数のインジケーターによるダイナミックトレーリングストップロス取引戦略

CPR EMA RSI ATR R2R
作成日: 2025-01-06 11:51:53 最終変更日: 2025-01-06 11:51:53
コピー: 1 クリック数: 319
1
フォロー
1617
フォロワー

複数のインジケーターによるダイナミックトレーリングストップロス取引戦略

概要

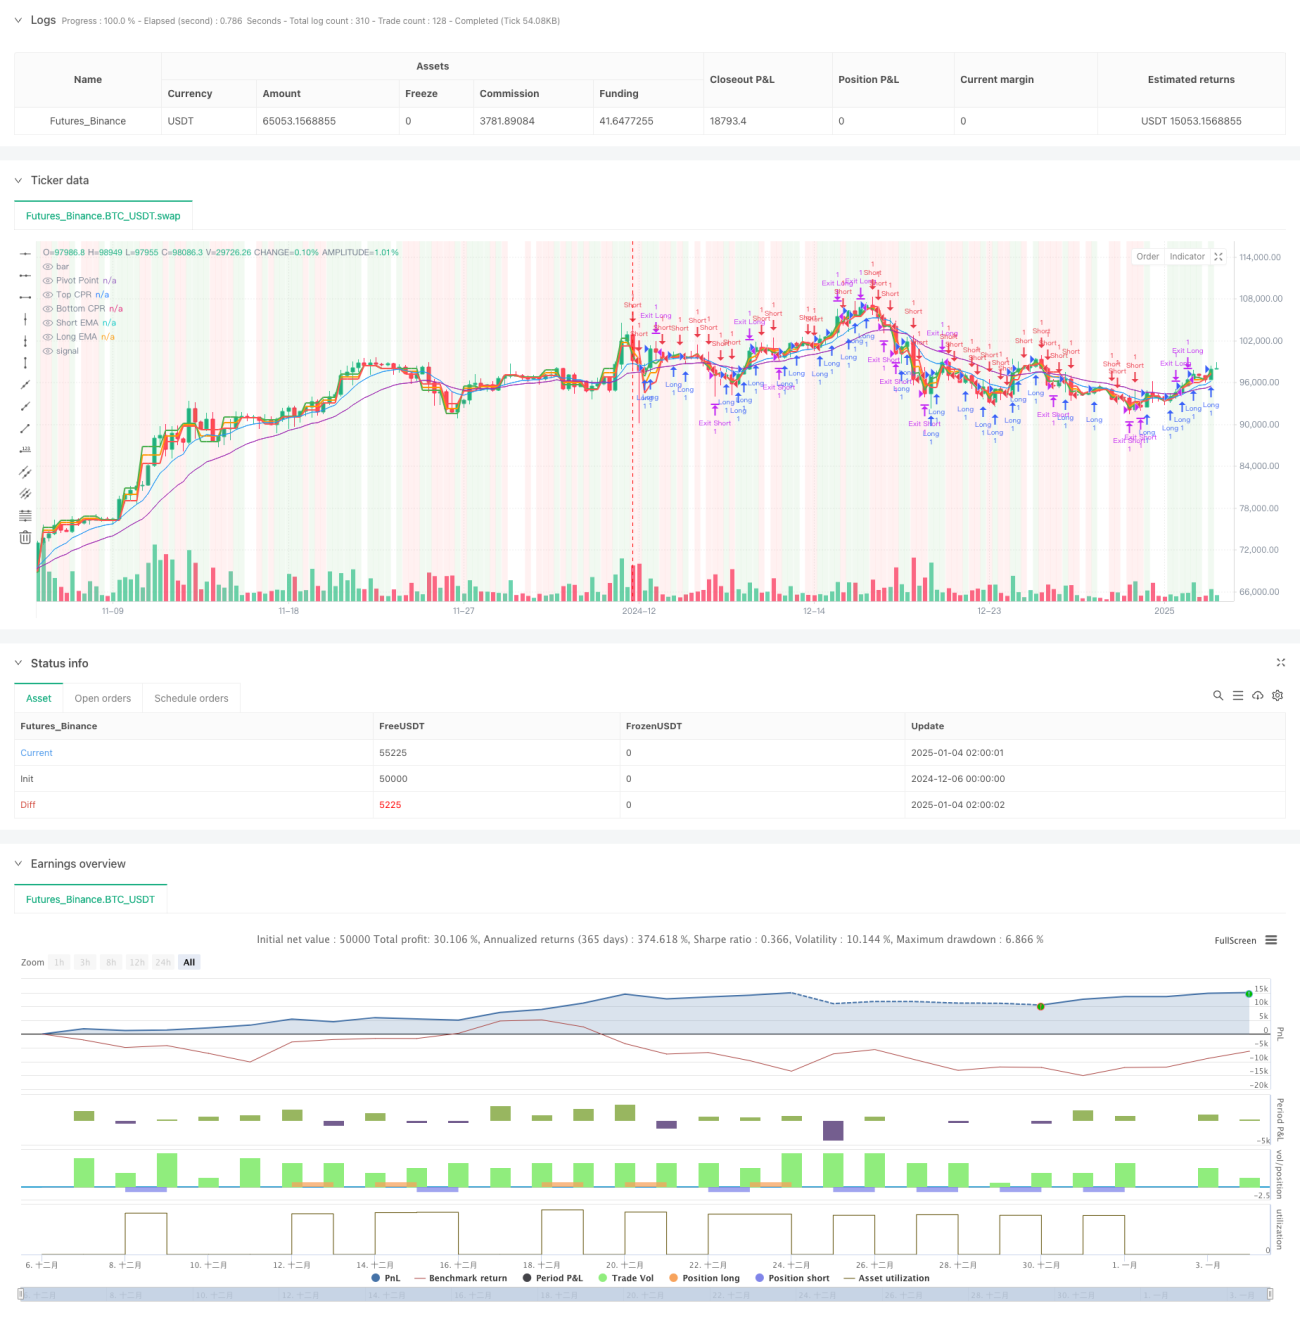
この戦略は、ピボット ポイント リファレンス (CPR)、指数移動平均 (EMA)、相対力指数 (RSI)、ブレイクアウト ロジックを組み合わせた包括的な取引システムです。この戦略は、ATR 動的追跡ストップロス メカニズムを採用し、複数のテクニカル指標の協調的な連携を通じて市場動向と取引機会を特定し、動的なリスク管理を実現します。この戦略は、日中取引および中期から短期の取引に適しており、優れた適応性とリスク管理機能を備えています。

戦略原則

この戦略は、次のコアコンポーネントに基づいています。

  1. CPR インジケーターは、主要なサポート レベルとレジスタンス レベルを決定し、ピボット ポイント、上限レール、下限レールを毎日計算するために使用されます。
  2. ダブル EMA システム (9 日間と 21 日間) は、トレンドの方向を決定し、ゴールデン クロスとデッド クロスを通じて取引シグナルを生成するために使用されます。
  3. RSI インジケーター (14 日間) は、市場の買われすぎまたは売られすぎの状態を確認するために使用され、取引フィルターとして機能します。
  4. ブレイクアウト ロジックには、ピボット ポイントの価格ブレイクアウトが組み込まれており、取引シグナルを確認します。
  5. ATR インジケーターは、動的なトレーリング ストップ ロスを設定し、市場のボラティリティに応じてストップ ロスの距離を適応的に調整するために使用されます。

戦略的優位性

  1. 複数のテクニカル指標を総合的に使用することで、シグナルの信頼性が向上します。
  2. ダイナミック トレーリング ストップ ロス メカニズムにより、利益を効果的に確保し、リスクを制御できます。
  3. CPR インジケーターは重要な価格参照ポイントを提供し、市場構造を正確に識別するのに役立ちます。
  4. この戦略は適応性に優れており、さまざまな市場状況に応じてパラメータを調整できます。
  5. RSI フィルターとブレイクアウト確認により、取引シグナルの品質が向上します。

戦略リスク

  1. 不安定な市場では、複数の指標によって遅延や誤ったシグナルが生じる可能性があります。
  2. ボラティリティが高い期間中は、トレーリング ストップが時期尚早にトリガーされる可能性があります。
  3. パラメータの最適化では市場特性を考慮する必要があり、不適切なパラメータ設定は戦略のパフォーマンスに影響を与える可能性があります。
  4. 矛盾する信号は意思決定の正確性に影響を与える可能性があります。

戦略最適化の方向性

  1. 価格ブレイクアウトの有効性を確認するためにボリュームインジケーターを導入します。
  2. トレンド追跡の精度を向上させるために、トレンド強度フィルターを追加します。
  3. ストップロスパラメータの動的調整メカニズムを最適化して、保護効果を向上させます。
  4. 取引パラメータを動的に調整するための市場ボラティリティ適応メカニズムを追加しました。
  5. 市場のタイミングを改善するために、感情指標の追加を検討してください。

要約する

この戦略は、複数のテクニカル指標の相乗効果を通じて、比較的完全な取引システムを構築します。動的なストップロスメカニズムと多次元シグナル確認により、リスクとリターンの特性が向上します。戦略の最適化の余地は、主に信号品質の向上とリスク管理の完成にあります。継続的な最適化と調整を通じて、この戦略はさまざまな市場環境において安定したパフォーマンスを維持することが期待されます。

ストラテジーソースコード
/*backtest
start: 2024-12-06 00:00:00
end: 2025-01-04 08:00:00
period: 7h
basePeriod: 7h
exchanges: [{"eid":"Futures_Binance","currency":"BTC_USDT"}]
*/

//@version=6
strategy("Enhanced CPR + EMA + RSI + Breakout Strategy", overlay=true)

// Inputs
ema_short = input(9, title="Short EMA Period")
ema_long = input(21, title="Long EMA Period")
cpr_lookback = input.timeframe("D", title="CPR Timeframe")
atr_multiplier = input.float(1.5, title="ATR Multiplier")
rsi_period = input(14, title="RSI Period")
rsi_overbought = input(70, title="RSI Overbought Level")
rsi_oversold = input(30, title="RSI Oversold Level")
breakout_buffer = input.float(0.001, title="Breakout Buffer (in %)")

// Calculate EMAs
short_ema = ta.ema(close, ema_short)
long_ema = ta.ema(close, ema_long)

// Request Daily Data for CPR Calculation
high_cpr = request.security(syminfo.tickerid, cpr_lookback, high)
low_cpr = request.security(syminfo.tickerid, cpr_lookback, low)
close_cpr = request.security(syminfo.tickerid, cpr_lookback, close)

// CPR Levels
pivot = (high_cpr + low_cpr + close_cpr) / 3
bc = (high_cpr + low_cpr) / 2
tc = pivot + (pivot - bc)

// ATR for Stop-Loss and Take-Profit
atr = ta.atr(14)

// RSI Calculation
rsi = ta.rsi(close, rsi_period)

// Entry Conditions with RSI Filter and Breakout Logic
long_condition = ((close > tc) and (ta.crossover(short_ema, long_ema)) and (rsi > 50 and rsi < rsi_overbought)) or (rsi > 80) or (close > (pivot + pivot * breakout_buffer))
short_condition = ((close < bc) and (ta.crossunder(short_ema, long_ema)) and (rsi < 50 and rsi > rsi_oversold)) or (rsi < 20) or (close < (pivot - pivot * breakout_buffer))

// Dynamic Exit Logic
long_exit = short_condition
short_exit = long_condition

// Trailing Stop-Loss Implementation
if long_condition
    strategy.entry("Long", strategy.long)
    strategy.exit("Exit Long", from_entry="Long", 
                  trail_points=atr * atr_multiplier, 
                  trail_offset=atr * atr_multiplier / 2)

if short_condition
    strategy.entry("Short", strategy.short)
    strategy.exit("Exit Short", from_entry="Short", 
                  trail_points=atr * atr_multiplier, 
                  trail_offset=atr * atr_multiplier / 2)

// Plot CPR Levels and EMAs
plot(pivot, title="Pivot Point", color=color.orange, linewidth=2)
plot(tc, title="Top CPR", color=color.green, linewidth=2)
plot(bc, title="Bottom CPR", color=color.red, linewidth=2)
plot(short_ema, title="Short EMA", color=color.blue, linewidth=1)
plot(long_ema, title="Long EMA", color=color.purple, linewidth=1)

// Highlight Buy and Sell Signals
bgcolor(long_condition ? color.new(color.green, 90) : na, title="Buy Signal Highlight")
bgcolor(short_condition ? color.new(color.red, 90) : na, title="Sell Signal Highlight")