RSIトレンドブレイクアウトとモメンタム強化取引戦略

RSI SMA MA HH QTY
作成日: 2025-01-06 13:43:48 最終変更日: 2025-01-06 13:43:48
コピー: 1 クリック数: 333
1
フォロー
1617
フォロワー

RSIトレンドブレイクアウトとモメンタム強化取引戦略

概要

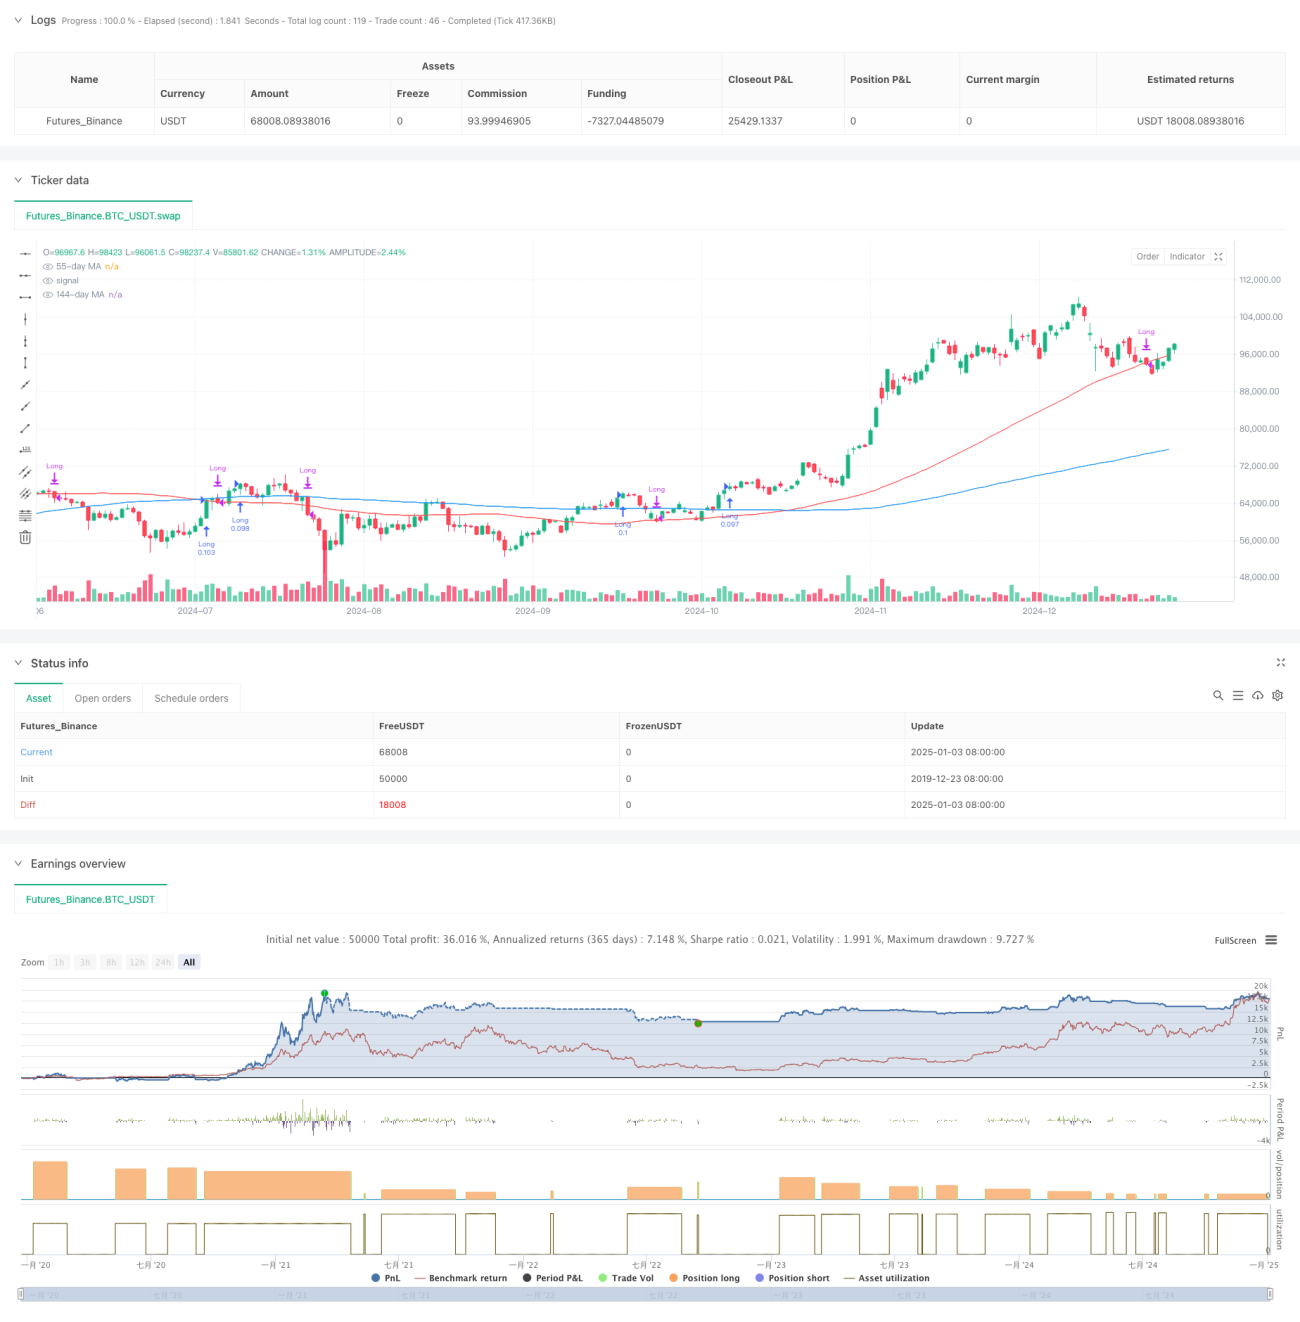
この戦略は、相対力指数 (RSI)、移動平均 (MA)、価格の勢いに基づいた包括的な取引システムです。この戦略は主に、RSI トレンドの変化、複数の期間の移動平均のクロスオーバー、および価格の勢いの変化を監視することで、潜在的な取引機会を特定します。この戦略は、RSI の上昇傾向と価格の継続的な上昇傾向に特に注目し、複数の確認を通じて取引の精度を向上させます。

戦略原則

戦略の中核となるロジックは、次の主要な要素に基づいています。

  1. RSIトレンド分析: 13期間のRSIインジケーターとその移動平均を使用して価格の強さを確認します
  2. 価格の勢いの確認: 上昇トレンドの持続性を確認するには、3回連続で高値を更新する必要がある
  3. 複数移動平均システム: 21日、55日、144日の移動平均をトレンドフィルターとして使用する
  4. 資金管理: 取引ごとに口座残高の10%をポジション管理に使用します 購入条件を満たす必要があります: RSI が平均より大きく、価格が連続して高値を形成し、RSI が上昇傾向を維持している 売り条件には、価格が55日移動平均を下回る、またはRSIが平均を下回り、価格が55日移動平均を下回るなどがあります。

戦略的優位性

  1. 多重確認メカニズム:RSI、価格モメンタム、移動平均システムの多重検証を通じて取引シグナルの信頼性を向上
  2. トレンド追跡能力:この戦略は中期および長期のトレンドを効果的に捉え、誤ったブレイクアウトを回避することができます。
  3. 完璧なリスク管理:ポジション管理と明確なストップロス条件を通じてリスクを管理します
  4. 高い適応性:さまざまな期間や市場環境に適用可能
  5. 合理的な資金管理:口座の自己資本比率を使用してポジションを管理し、固定ポジションのリスクを回避します。

戦略リスク

  1. 遅延リスク: 移動平均と RSI インジケーターには一定の遅延があり、エントリーとエグジットのタイミングに若干の遅れが生じる可能性があります。
  2. 不安定な市場のリスク: 横ばいで不安定な市場では、誤ったシグナルが頻繁に発生する可能性があります。
  3. 継続的な損失リスク:市場変動期間中に継続的なストップロスに直面する可能性があります 解決:
  • 市場環境フィルターを追加
  • 指標パラメータの最適化
  • ボラティリティ適応メカニズムの導入

戦略最適化の方向性

  1. インジケーターパラメータの最適化:
  • 適応型RSIサイクルの使用を検討する
  • さまざまな市場サイクルに応じて移動平均パラメータを調整する
  1. 市場環境の識別を強化する:
  • ボラティリティ指標の紹介
  • トレンド強度フィルターを追加
  1. リスク管理の改善:
  • 動的ストップロスメカニズムの実装
  • 利益目標管理の向上
  1. ポジション管理を最適化:
  • 信号強度に基づいてポジションサイズを調整する
  • バッチでポジションを構築および削減するメカニズムを実装する

要約する

この戦略は、テクニカル分析指標とモメンタム分析手法を総合的に使用して、比較的完全な取引システムを構築します。この戦略の利点は、複数の確認メカニズムと完璧なリスク管理にありますが、市場環境への適応性とパラメータの最適化の問題にも注意を払う必要があります。継続的な最適化と改善により、この戦略は堅牢な取引システムになる可能性があります。

ストラテジーソースコード
/*backtest
start: 2019-12-23 08:00:00
end: 2025-01-04 08:00:00
period: 1d
basePeriod: 1d
exchanges: [{"eid":"Futures_Binance","currency":"BTC_USDT"}]
*/

//@version=5
strategy("Improved Strategy with RSI Trending Upwards", overlay=true)

// Inputs for moving averages
ma21_length = input.int(21, title="21-day MA Length")
ma55_length = input.int(55, title="55-day MA Length")
ma144_length = input.int(144, title="144-day MA Length")

// Moving averages
ma21 = ta.sma(close, ma21_length)
ma55 = ta.sma(close, ma55_length)
ma144 = ta.sma(close, ma144_length)

// RSI settings
rsi_length = input.int(13, title="RSI Length")
rsi_avg_length = input.int(13, title="RSI Average Length")
rsi = ta.rsi(close, rsi_length)
rsi_avg = ta.sma(rsi, rsi_avg_length)

// RSI breakout condition
rsi_breakout = ta.crossover(rsi, rsi_avg)

// RSI trending upwards
rsi_trending_up = rsi > rsi[1] and rsi[1] > rsi[2]

// Higher high condition
hh1 = high[2] > high[3]  // 1st higher high
hh2 = high[1] > high[2]  // 2nd higher high
hh3 = high > high[1]     // 3rd higher high
higher_high_condition = hh1 and hh2 and hh3

// Filter for trades starting after 1st January 2007
date_filter = (year >= 2007 and month >= 1 and dayofmonth >= 1)

// Combine conditions for buying
buy_condition = rsi > rsi_avg and higher_high_condition and rsi_trending_up //and close > ma21 and ma21 > ma55
// buy_condition = rsi > rsi_avg and rsi_trending_up

// Sell condition
// Sell condition: Close below 21-day MA for 3 consecutive days
downtrend_condition = close < close[1] and close[1] < close[2] and close[2] < close[3] and close[3] < close[4] and close[4] < close[5]
// downtrend_condition = close < close[1] and close[1] < close[2] and close[2] < close[3]

sell_condition_ma21 = close < ma55 and close[1] < ma55 and close[2] < ma55 and close[3] < ma55 and close[4] < ma55 and downtrend_condition

// Final sell condition
sell_condition = ta.crossunder(close, ma55) or (ta.crossunder(rsi, rsi_avg) and ta.crossunder(close, ma55))

// Execute trades
if (buy_condition and date_filter)
    // strategy.entry("Long", strategy.long, comment="Buy")
    strategy.entry("Long", strategy.long, qty=strategy.equity * 0.1 / close)
if (sell_condition and date_filter)
    strategy.close("Long", comment="Sell")

// Plot moving averages
plot(ma55, color=color.red, title="55-day MA")
plot(ma144, color=color.blue, title="144-day MA")