マルチインジケータークロスオーバーダイナミックモメンタム戦略

EMA RSI SMA MACD ADX
作成日: 2025-01-06 14:00:47 最終変更日: 2025-01-06 14:00:47
コピー: 0 クリック数: 385
1
フォロー
1617
フォロワー

マルチインジケータークロスオーバーダイナミックモメンタム戦略

概要

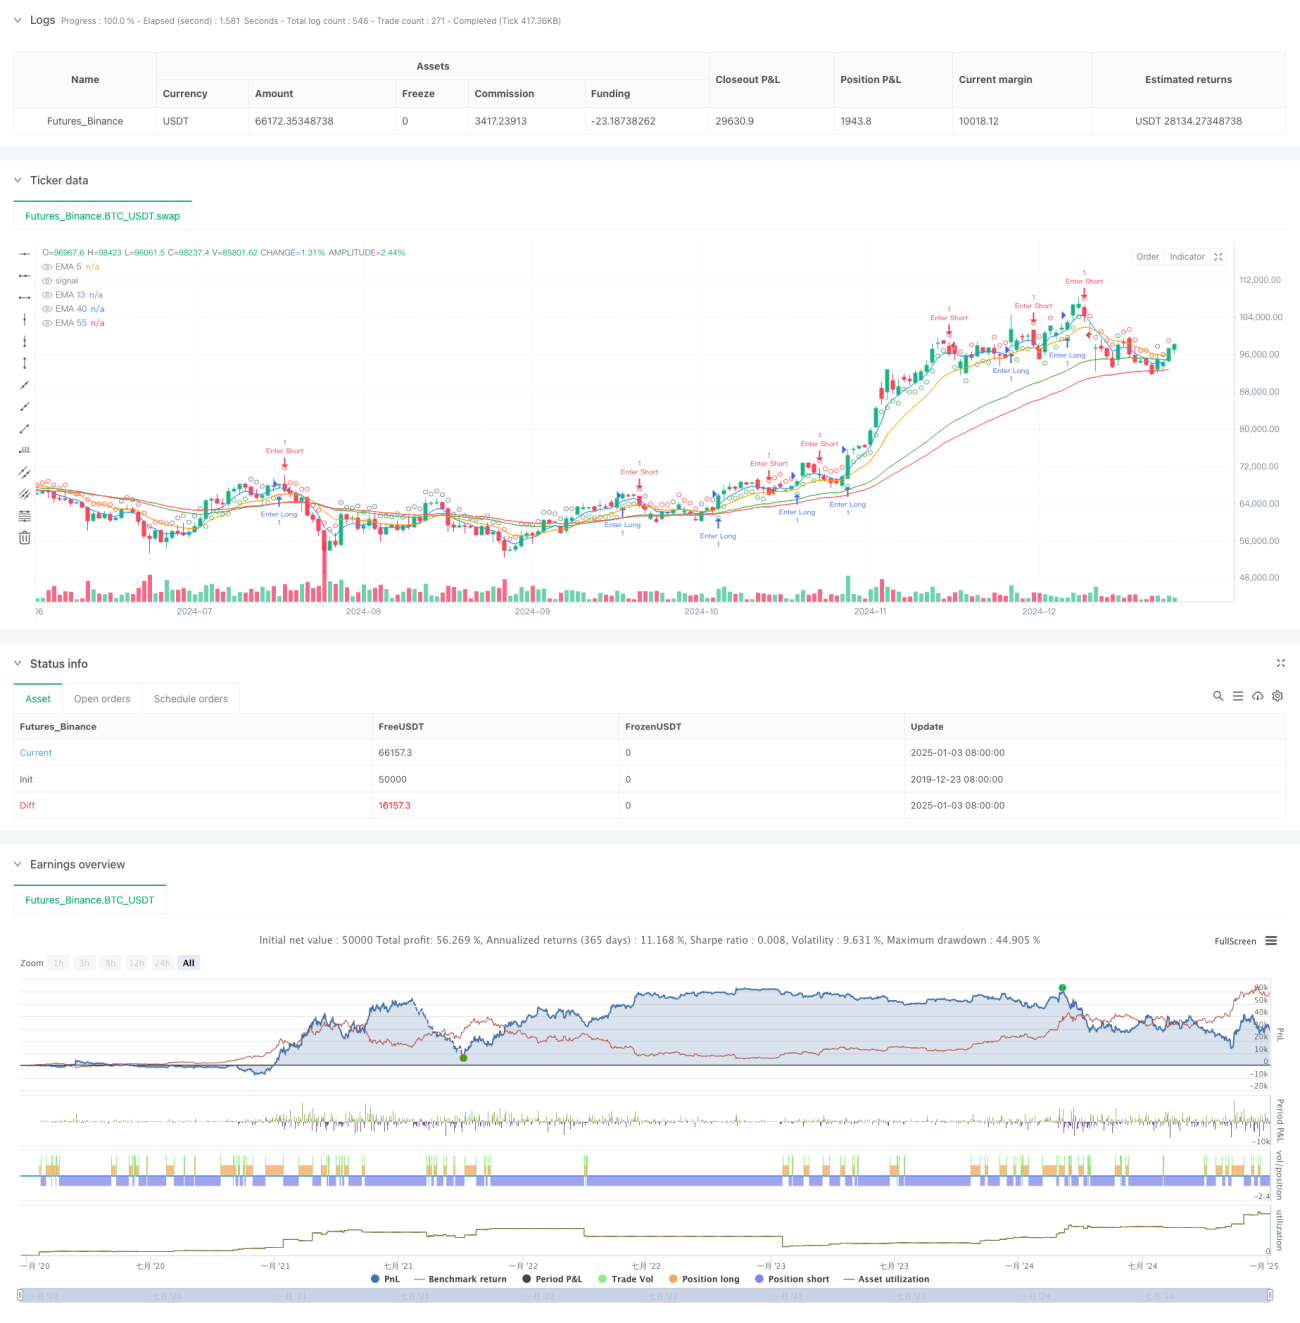
この戦略は、複数のテクニカル指標に基づく取引システムであり、主に指数移動平均 (EMA)、相対力指数 (RSI)、距離計算という 3 つのコア コンポーネントを組み合わせています。この戦略は、シグナルの安定性を維持し、誤ったブレイクスルーや不安定な市場状況を効果的に回避しながら、市場トレンドの強さと勢いの変化を動的に監視します。このシステムは多重確認メカニズムを採用しており、指標間の相対距離と動的閾値を計算することで市場状況の正確な判断を実現します。

戦略原則

この戦略では、異なる期間(5、13、40、55 期間)の 4 つの EMA ラインを使用してトレンド フレームワークを構築し、RSI インジケーター(14 期間)を使用して市場の方向判断を強化します。具体的には:

  1. 5期間EMAが13期間EMAを上回り、40期間EMAが55期間EMAを上回った場合、システムはロングシグナルを発行します。
  2. RSI 値が 50 を超え、14 期間の平均を超えると、強気トレンドが確認されます。
  3. システムは、EMA5 と EMA13 間の距離を計算し、それを過去 5 本の K ラインの平均距離と比較してトレンドの強さを決定します。
  4. RSI が 60 を超えると強い買いシグナルとなり、40 を下回ると強い売りシグナルとなります。
  5. EMA40とEMA13間の距離の変化を計算してトレンドの継続性を確認します。

戦略的優位性

  1. 複数の確認メカニズムにより誤った信号が大幅に減少
  2. 動的距離計算はトレンドの強さの変化を識別するのに役立ちます
  3. RSI閾値設計により、市場の強弱の判断がさらに可能になる
  4. 信号継続性判定メカニズムにより、頻繁な取引のリスクを軽減
  5. トレンド転換点警告機能により、事前に計画を立てるのに役立ちます
  6. このシステムは適応性に優れており、さまざまな市場環境に適応できます。

戦略リスク

  1. 横ばい市場では中立的なシグナルが多すぎる可能性がある
  2. 複数のインジケーターにより信号遅延が発生する場合があります
  3. 過度なパラメータ最適化は過剰適合を引き起こす可能性がある
  4. トレンドが急速に反転すると、大きなリトレースメントが発生する可能性がある。
  5. EMAクロスオーバーからの偽のブレイクアウトには追加のフィルタリングが必要

戦略最適化の方向性

  1. 信号の信頼性を高めるためにボリュームインジケーターを導入
  2. RSIパラメータを最適化して市場の転換点を予測する能力を向上させる
  3. ATRインジケーターを追加してストップロスポジションを動的に調整する
  4. 戦略の安定性を向上させる適応パラメータシステムを開発する
  5. 複数期間の信号確認メカニズムの構築
  6. 誤ったシグナルを減らすためにボラティリティフィルターを追加する

要約する

この戦略は、複数のテクニカル指標の協調的な連携を通じて信号の安定性を維持しながら、リスクを効果的に制御します。システム設計では市場の多様性を十分に考慮し、動的閾値と距離計算方法を採用して適応性を向上させています。継続的な最適化と改善を通じて、この戦略はさまざまな市場環境において安定したパフォーマンスを維持することが期待されます。

ストラテジーソースコード
/*backtest
start: 2019-12-23 08:00:00
end: 2025-01-04 08:00:00
period: 1d
basePeriod: 1d
exchanges: [{"eid":"Futures_Binance","currency":"BTC_USDT"}]
*/

//@version=6
strategy("EMA Crossover Strategy with RSI Average, Distance, and Signal Persistence", overlay=true, fill_orders_on_standard_ohlc=true)

// Define EMAs
ema5 = ta.ema(close, 5)
ema13 = ta.ema(close, 13)
ema40 = ta.ema(close, 40)
ema55 = ta.ema(close, 55)

// Calculate 14-period RSI
rsi = ta.rsi(close, 14)

// Calculate the RSI average
averageRsiLength = 14  // Length for RSI average
averageRsi = ta.sma(rsi, averageRsiLength)

// Define conditions
emaShortTermCondition = ema5 > ema13  // EMA 5 > EMA 13
emaLongTermCondition = ema40 > ema55  // EMA 40 > EMA 55
rsiCondition = rsi > 50 and rsi > averageRsi  // RSI > 50 and RSI > average RSI

// Track the distance between ema5 and ema13 for the last 5 candles
distance = math.abs(ema5 - ema13)
distanceWindow = 5
distances = array.new_float(distanceWindow, 0.0)
array.shift(distances)
array.push(distances, distance)

// Calculate the average distance of the last 5 distances
avgDistance = array.avg(distances)

// Track distance between EMA40 and EMA13 for the last few candles
distance40_13 = math.abs(ema40 - ema13)
distanceWindow40_13 = 5
distances40_13 = array.new_float(distanceWindow40_13, 0.0)
array.shift(distances40_13)
array.push(distances40_13, distance40_13)

// Calculate the average distance for EMA40 and EMA13
avgDistance40_13 = array.avg(distances40_13)

// Neutral condition: if the current distance is lower than the average of the last 5 distances
neutralCondition = distance < avgDistance or ema13 > ema5

// Short signal condition: EMA40 crosses above EMA55
shortCondition = ema40 > ema55

// Conditions for Green and Red signals (based on RSI thresholds)
greenSignalCondition = rsi > 60  // Green if RSI > 60, regardless of EMAs
redSignalCondition = rsi < 40  // Red if RSI < 40, regardless of EMAs

// Combine conditions for a buy signal (Long)
longCondition = emaShortTermCondition and emaLongTermCondition and rsiCondition and not neutralCondition

// Store the last signal (initialized as na)
var string lastSignal = na

// Track previous distance between EMA40 and EMA13
var float prevDistance40_13 = na

// Check if the current distance between EMA40 and EMA13 is greater than the previous
distanceCondition = (not na(prevDistance40_13)) ? (distance40_13 > prevDistance40_13) : true

// Update the lastSignal only if the current candle closes above EMA5, otherwise recalculate it
if (close > ema5)
    if (longCondition and distanceCondition)
        lastSignal := "long"
    else if (shortCondition and distanceCondition)
        lastSignal := "short"
    else if (neutralCondition)
        lastSignal := "neutral"
    // Add green signal based on RSI
    else if (greenSignalCondition)
        lastSignal := "green"
    // Add red signal based on RSI
    else if (redSignalCondition)
        lastSignal := "red"

// If current candle doesn't close above EMA5, recalculate the signal based on current conditions
if (close <= ema5)
    if (longCondition)
        lastSignal := "long"
    else if (shortCondition)
        lastSignal := "short"
    else if (greenSignalCondition)
        lastSignal := "green"
    else if (redSignalCondition)
        lastSignal := "red"
    else
        lastSignal := "neutral"

// Update previous distance for next comparison
prevDistance40_13 := distance40_13

// Set signal conditions based on lastSignal
isLong = lastSignal == "long"
isShort = lastSignal == "short"
isNeutral = lastSignal == "neutral"
isGreen = lastSignal == "green"
isRed = lastSignal == "red"

// Plot signals with preference for long (green) and short (red), no multiple signals per bar
plotshape(isLong, style=shape.circle, color=color.green, location=location.belowbar, size=size.tiny)
plotshape(isShort and not isLong, style=shape.circle, color=color.red, location=location.abovebar, size=size.tiny)
plotshape(isNeutral and not isLong and not isShort, style=shape.circle, color=color.gray, location=location.abovebar, size=size.tiny)
plotshape(isGreen and not isLong and not isShort and not isNeutral, style=shape.circle, color=color.green, location=location.belowbar, size=size.tiny)
plotshape(isRed and not isLong and not isShort and not isNeutral, style=shape.circle, color=color.red, location=location.abovebar, size=size.tiny)

// Plot EMAs for visualization
plot(ema5, color=color.blue, title="EMA 5")
plot(ema13, color=color.orange, title="EMA 13")
plot(ema40, color=color.green, title="EMA 40")
plot(ema55, color=color.red, title="EMA 55")

// Plot RSI average for debugging (optional, remove if not needed)
// plot(averageRsi, title="Average RSI", color=color.orange)
// hline(50, title="RSI 50", color=color.gray)  // Optional: Comment this out too if not needed


if isLong
    strategy.entry("Enter Long", strategy.long)
else if isShort
    strategy.entry("Enter Short", strategy.short)