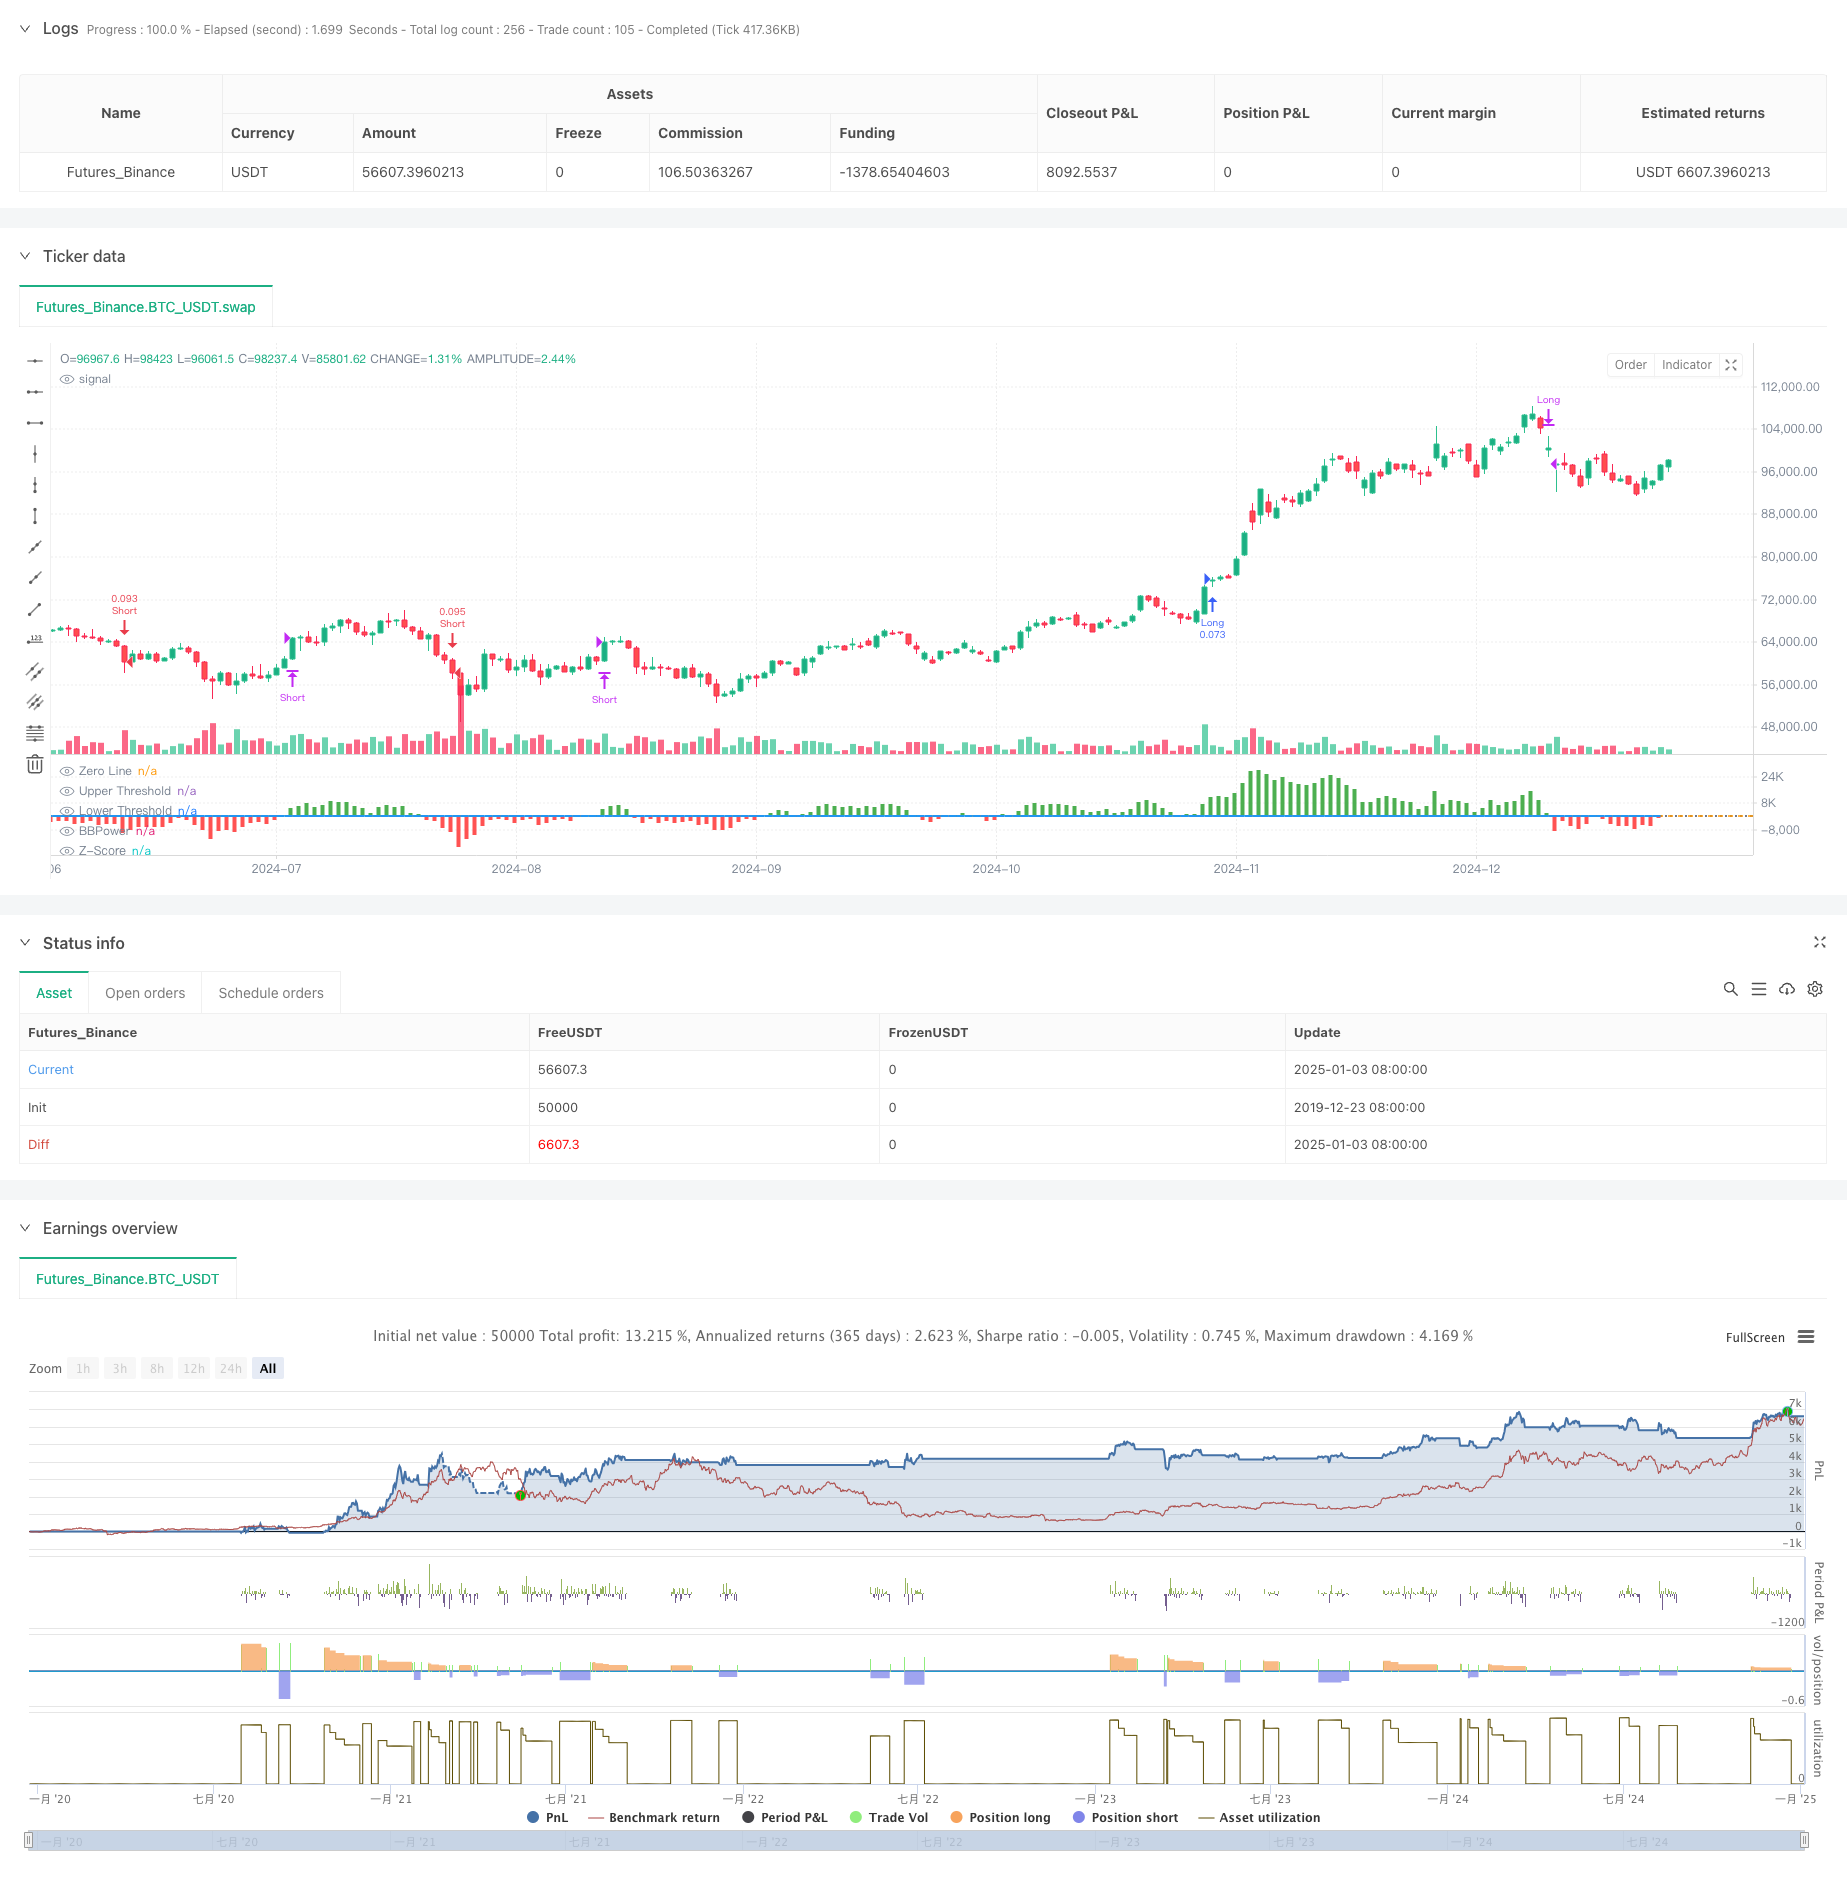
概要
この戦略は、Bull Bear Power インジケーターと、ボリューム パーセンタイルに基づくマルチレベルの動的利益獲得システムを組み合わせた定量的取引戦略です。この戦略は、価格、ボリューム、モメンタムなどの多次元データを分析することで、適応性が高くリスクが制御された取引システムを構築します。コアロジックには、BBPインジケーターのZスコア標準化値を取引シグナルのトリガー条件として使用し、ボリュームパーセンタイル分析を組み合わせて利益確定レベルを動的に調整し、さまざまな市場ボラティリティ状態を正確に把握することが含まれます。
戦略原則
戦略の中核となる計算には、次の主要な部分が含まれます。
- BBP インジケーターの計算: 最高価格と EMA の差 (強気のパワー) と最低価格と EMA の差 (弱気のパワー) の合計を計算して、市場力の比較を測定します。
- Z スコア標準化: BBP 値は、現在の市場の強さの偏差レベルを決定するために標準化されます。
- ボリューム分析: 移動平均に対する現在のボリュームを計算して、市場の活動を判断します。
- 分位分析: 市場状況の確率分布について、価格と数量の過去の分位を計算します。
- 動的テイクプロフィット: ATR、ボリュームパーセンタイル、価格パーセンタイルの総合スコアに基づいて、テイクプロフィット距離を動的に調整します。
戦略的優位性
- 多次元分析: 価格の勢い、ボリューム、市場ポジションを総合的に考慮し、より包括的な市場の見通しを提供します。
- 強力な適応性: 動的に調整された利益確定メカニズムにより、さまざまな市場環境に適応できます。
- リスク分散: 多段階の利益確定戦略を採用し、異なる価格レベルで利益の獲得を実現します。
- 確率的優位性: Z スコアと分位分析により、統計的に有意な優位性があります。
- 拡張性: ポリシー フレームワークは優れた拡張性を備えており、必要に応じて新しい分析ディメンションを追加できます。
戦略リスク
- パラメータ感度: 戦略には複数のパラメータが含まれており、さまざまな市場環境に合わせて最適化する必要があります。
- 市場環境への依存: 極端なボラティリティやトレンドの変化の期間中はパフォーマンスが低下する可能性があります。
- 執行スリッページ: マルチレベルの利益確定注文では執行スリッページが発生し、実際の収益に影響する可能性があります。
- 計算の複雑さ: 複数の指標をリアルタイムで計算すると、一定のシステム負荷が発生する可能性があります。
- 誤ったシグナルのリスク: 横ばい市場では誤った取引シグナルが生成される場合があります。
最適化の方向
- パラメータ適応: 機械学習手法を導入して、パラメータの自動最適化を実現します。
- 市場予測: 市場環境分類モジュールを追加して、不利な取引環境を事前に特定します。
- ストップロスの最適化: 動的なストップロスのメカニズムを導入して、リスク管理の精度を向上させます。
- 信号フィルタリング: トレンド強度フィルターを追加して、誤った信号を減らします。
- ポジション管理: ポジション割り当てアルゴリズムを最適化し、資本使用の効率を向上します。
要約する
この戦略は、従来の BBP インジケーターと最新の定量分析手法を組み合わせて、堅固な理論的基礎と強力な実用性を備えた取引システムを構築します。多段階の利益確定と動的な調整メカニズムを通じて、収益とリスクのより良いバランスが実現されます。パラメータの最適化にはある程度の難しさがありますが、戦略フレームワークのスケーラビリティにより、その後の最適化に十分な余地が提供されます。実際の適用においては、トレーダーは特定の市場特性と自身のリスク選好に基づいて的を絞った調整を行うことをお勧めします。
ストラテジーソースコード
/*backtest
start: 2019-12-23 08:00:00
end: 2025-01-04 08:00:00
period: 1d
basePeriod: 1d
exchanges: [{"eid":"Futures_Binance","currency":"BTC_USDT"}]
*/

// This Pine Script™ code is subject to the terms of the Mozilla Public License 2.0 at https://mozilla.org/MPL/2.0/
// © PresentTrading

// The BBP Strategy with Volume-Percentile TP by PresentTrading emerges as a sophisticated approach that integrates multiple analytical layers to enhance trading precision and profitability.
// Unlike traditional strategies that rely solely on price movements or volume indicators, this strategy synergizes Bollinger Bands Power (BBP) with volume percentile analysis to determine optimal entry and exit points. Additionally, it employs a dynamic take-profit mechanism based on ATR (Average True Range) multipliers adjusted by volume and percentile factors, ensuring adaptability to varying market conditions.
// This multi-faceted approach not only enhances signal accuracy but also optimizes risk management, setting it apart from conventional trading methodologies.

//@version=5
strategy("BBP Strategy with Volume-Percentile TP - Strategy [presentTrading] ", overlay=false, precision=3, commission_value= 0.1, commission_type=strategy.commission.percent, slippage= 1, currency=currency.USD, default_qty_type = strategy.percent_of_equity, default_qty_value = 10, initial_capital=10000)


// ————————
// Bull Bear Power Strategy Settings
// ————————
lengthInput = input.int(21, "EMA Length")
zLength     = input.int(252, "Z-Score Length")
zThreshold  = input.float(1.618, "Z-Score Threshold")

// ————————
// Take Profit Settings
// ————————
tp_group = "Take Profit Settings"
// Enable/disable take profit function
useTP = input.bool(true, "Use Take Profit", group=tp_group)

// === ATR Base Settings ===
// ATR calculation period for determining base price movement range
baseAtrLength = input.int(20, "ATR Period", minval=1, group=tp_group, tooltip="ATR period for calculating base price movement range. Shorter periods are more sensitive to recent volatility")

// === Take Profit Multiplier Settings ===
// First take profit ATR multiplier, usually the most conservative target
atrMult1 = input.float(1.618, "TP1 ATR Multiplier", minval=0.1, step=0.1, group=tp_group, tooltip="First take profit level ATR multiplier, recommended 1.5-2.0")
// Second take profit ATR multiplier, medium profit target
atrMult2 = input.float(2.382, "TP2 ATR Multiplier", minval=0.1, step=0.1, group=tp_group, tooltip="Second take profit level ATR multiplier, recommended 2.5-3.0")
// Third take profit ATR multiplier, most aggressive target
atrMult3 = input.float(3.618, "TP3 ATR Multiplier", minval=0.1, step=0.1, group=tp_group, tooltip="Third take profit level ATR multiplier, recommended 4.0-5.0")

// === Position Size Allocation ===
// First take profit position size, usually larger for securing basic profits
tp1_size = input.float(13, "TP1 Position %", minval=1, maxval=100, group=tp_group, tooltip="Position size percentage for first take profit, recommended 30-40%")
// Second take profit position size, medium allocation
tp2_size = input.float(13, "TP2 Position %", minval=1, maxval=100, group=tp_group, tooltip="Position size percentage for second take profit, recommended 30-40%")
// Third take profit position size, usually smaller for catching larger moves
tp3_size = input.float(13, "TP3 Position %", minval=1, maxval=100, group=tp_group, tooltip="Position size percentage for third take profit, recommended 20-30%")

// ————————
// Volume Analysis Settings
// ————————
vol_group = "Volume Analysis Settings"
// Volume MA period for determining relative volume levels
vol_period = input.int(100, "Volume MA Period", minval=1, group=vol_group, tooltip="Period for calculating volume moving average, recommended 20-30")

// === Volume Level Thresholds ===
// High volume threshold relative to MA
vol_high = input.float(2.0, "High Volume Multiplier", minval=1.0, step=0.1, group=vol_group, tooltip="High volume threshold multiplier, typically 2x MA or above")
// Medium volume threshold
vol_med = input.float(1.5, "Medium Volume Multiplier", minval=1.0, step=0.1, group=vol_group, tooltip="Medium volume threshold multiplier, typically around 1.5x MA")
// Low volume threshold
vol_low = input.float(1.0, "Low Volume Multiplier", minval=0.5, step=0.1, group=vol_group, tooltip="Low volume threshold multiplier, typically around 1x MA")

// === Volume Adjustment Factors ===
// High volume adjustment factor, usually extends take profit targets
vol_high_mult = input.float(1.5, "High Volume Factor", minval=0.1, step=0.1, group=vol_group, tooltip="Take profit adjustment factor for high volume")
// Medium volume adjustment factor
vol_med_mult = input.float(1.3, "Medium Volume Factor", minval=0.1, step=0.1, group=vol_group, tooltip="Take profit adjustment factor for medium volume")
// Low volume adjustment factor
vol_low_mult = input.float(1.0, "Low Volume Factor", minval=0.1, step=0.1, group=vol_group, tooltip="Take profit adjustment factor for low volume")

// ————————
// Percentile Analysis Settings
// ————————
perc_group = "Percentile Analysis Settings"
// Percentile calculation period for evaluating price position
perc_period = input.int(100, "Percentile Period", minval=20, group=perc_group, tooltip="Historical period for percentile calculations, recommended 100-200")

// === Percentile Thresholds ===
// High percentile threshold, typically indicates relative high levels
perc_high = input.float(90, "High Percentile", minval=50, maxval=100, group=perc_group, tooltip="High level percentile threshold, typically above 90")
// Medium percentile threshold
perc_med = input.float(80, "Medium Percentile", minval=50, maxval=100, group=perc_group, tooltip="Medium level percentile threshold, typically around 80")
// Low percentile threshold
perc_low = input.float(70, "Low Percentile", minval=0, maxval=100, group=perc_group, tooltip="Low level percentile threshold, typically around 70")

// === Percentile Adjustment Factors ===
// High percentile adjustment factor
perc_high_mult = input.float(1.5, "High Percentile Factor", minval=0.1, step=0.1, group=perc_group, tooltip="Take profit adjustment factor for high percentile levels")
// Medium percentile adjustment factor
perc_med_mult = input.float(1.3, "Medium Percentile Factor", minval=0.1, step=0.1, group=perc_group, tooltip="Take profit adjustment factor for medium percentile levels")
// Low percentile adjustment factor
perc_low_mult = input.float(1.0, "Low Percentile Factor", minval=0.1, step=0.1, group=perc_group, tooltip="Take profit adjustment factor for low percentile levels")


// ————————
// Core Bull Bear Power Calculations
// ————————
emaClose  = ta.ema(close, lengthInput)
bullPower = high - emaClose
bearPower = low  - emaClose
bbp       = bullPower + bearPower

bbp_mean  = ta.sma(bbp, zLength)
bbp_std   = ta.stdev(bbp, zLength)
zscore    = (bbp - bbp_mean) / bbp_std

// ————————
// Volume & Percentile Analysis
// ————————
// 成交量分析
vol_sma = ta.sma(volume, vol_period)
vol_mult = volume / vol_sma

// 百分位數計算
calcPercentile(src) =>
    var values = array.new_float(0)
    array.unshift(values, src)
    if array.size(values) > perc_period
        array.pop(values)
    array.size(values) > 0 ? array.percentrank(values, array.size(values)-1) * 100 : 50

price_perc = calcPercentile(close)
vol_perc = calcPercentile(volume)

// 止盈動態調整系數計算
getTpFactor() =>
    vol_score = vol_mult > vol_high ? vol_high_mult : vol_mult > vol_med ? vol_med_mult : vol_mult > vol_low ? vol_low_mult : 0.8
    price_score = price_perc > perc_high ? perc_high_mult :price_perc > perc_med ? perc_med_mult :price_perc > perc_low ? perc_low_mult : 0.8
    math.avg(vol_score, price_score)

// ————————
// Entry/Exit Logic
// ————————
longCondition  = ta.crossover(zscore,  zThreshold)
shortCondition = ta.crossunder(zscore, -zThreshold)
exitLongCondition  = ta.crossunder(zscore, 0)
exitShortCondition = ta.crossover(zscore,  0)

if (barstate.isconfirmed)
    if longCondition
        strategy.entry("Long", strategy.long)
    if shortCondition
        strategy.entry("Short", strategy.short)
    if exitLongCondition
        strategy.close("Long")
    if exitShortCondition
        strategy.close("Short")

// ————————
// Take Profit Execution
// ————————
if useTP and strategy.position_size != 0
    base_move = ta.atr(baseAtrLength)
    tp_factor = getTpFactor()
    is_long = strategy.position_size > 0
    entry_price = strategy.position_avg_price

    if is_long
        tp1_price = entry_price + (base_move * atrMult1 * tp_factor)
        tp2_price = entry_price + (base_move * atrMult2 * tp_factor)
        tp3_price = entry_price + (base_move * atrMult3 * tp_factor)

        strategy.exit("TP1", "Long", qty_percent=tp1_size, limit=tp1_price)
        strategy.exit("TP2", "Long", qty_percent=tp2_size, limit=tp2_price)
        strategy.exit("TP3", "Long", qty_percent=tp3_size, limit=tp3_price)
    else
        tp1_price = entry_price - (base_move * atrMult1 * tp_factor)
        tp2_price = entry_price - (base_move * atrMult2 * tp_factor)
        tp3_price = entry_price - (base_move * atrMult3 * tp_factor)

        strategy.exit("TP1", "Short", qty_percent=tp1_size, limit=tp1_price)
        strategy.exit("TP2", "Short", qty_percent=tp2_size, limit=tp2_price)
        strategy.exit("TP3", "Short", qty_percent=tp3_size, limit=tp3_price)

// ————————
// Plotting
// ————————
plot(bbp, color=bbp >= 0 ? color.new(color.green, 0) : color.new(color.red, 0),
     title="BBPower", style=plot.style_columns)
hline(0, "Zero Line", color=color.gray, linestyle=hline.style_dotted)
plot(zscore, title="Z-Score", color=color.blue, linewidth=2)
hline(zThreshold, "Upper Threshold", color=color.orange, linestyle=hline.style_dashed)
hline(-zThreshold, "Lower Threshold", color=color.orange, linestyle=hline.style_dashed)