
1
Follow
1781
Followers
概要
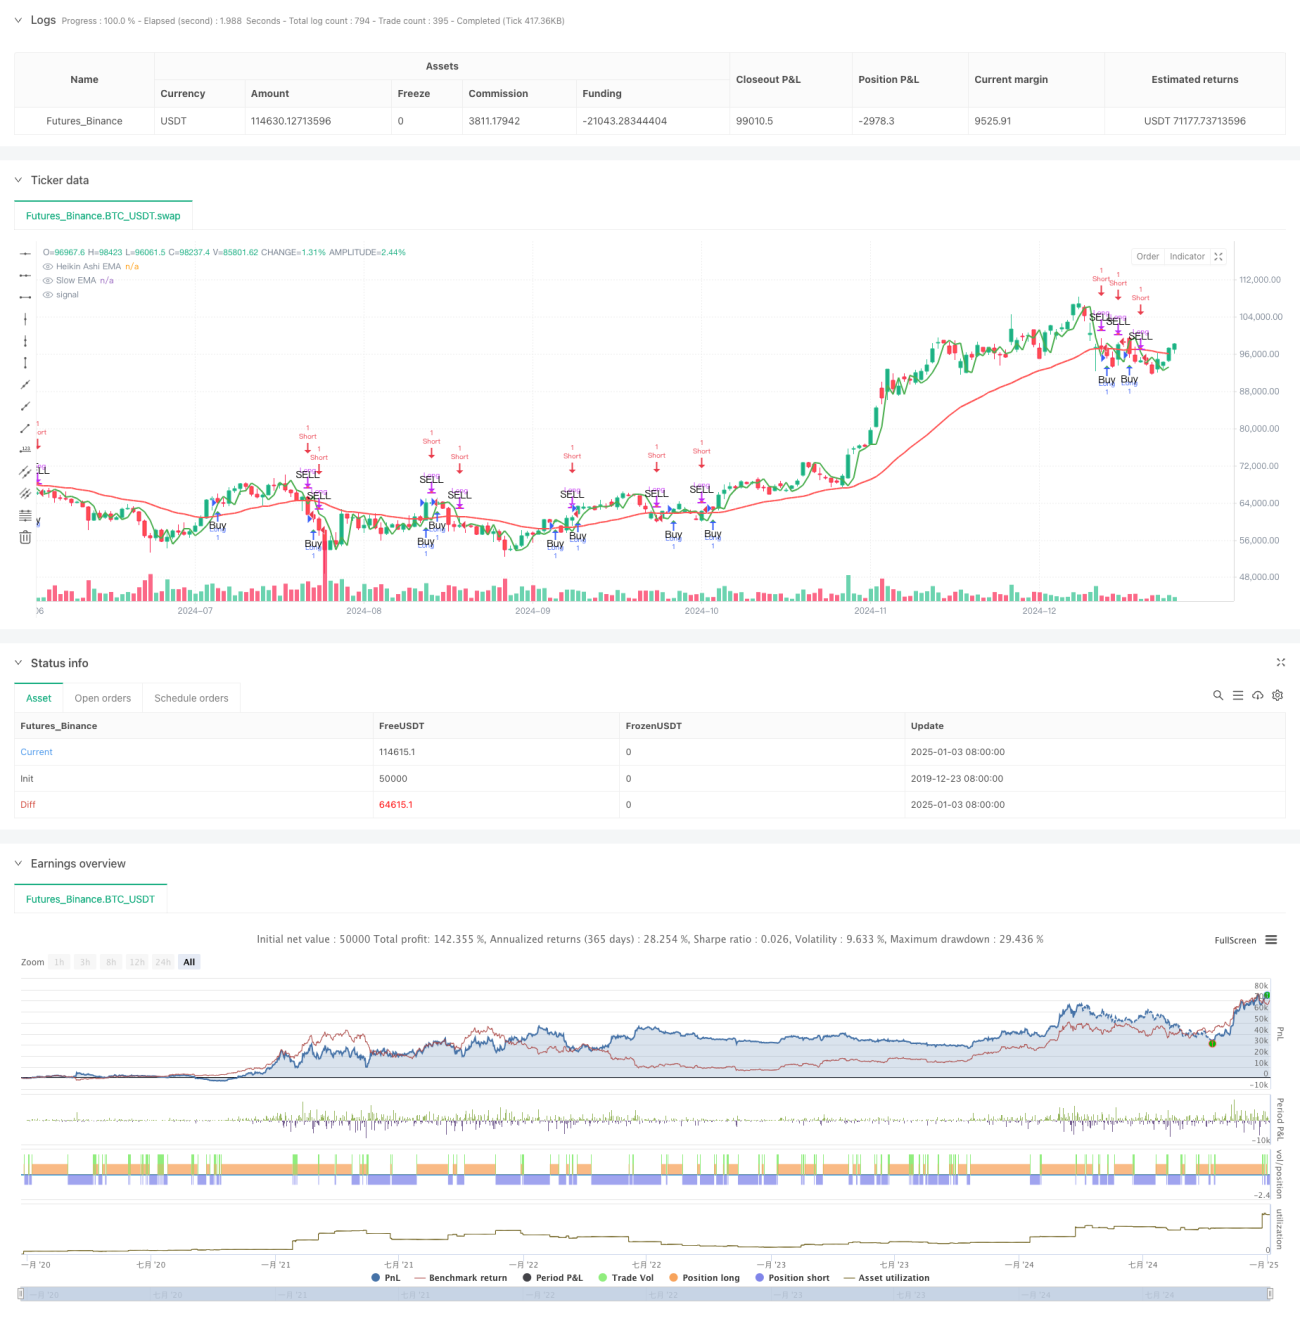
この戦略は、平滑化されたローソク足(平均足)と指数移動平均(EMA)のクロスオーバーに基づく、複数期間のトレンド追跡システムです。平均足ローソク足の平滑化特性と、さまざまな期間にわたる移動平均のトレンド追跡機能を組み合わせ、MACD インジケーターをフィルターとして使用することで、市場トレンドを正確に捉えることができます。この戦略は、時間間隔の階層設計を採用し、60 分、180 分、15 分の 3 つの時間間隔で信号の計算と検証を実行します。
戦略原則
戦略の中核となるロジックには、次の主要な部分が含まれます。
- 平均足ローソク足計算: 始値、高値、安値、終値を計算する特別な方法により、生の価格データを平滑化し、市場のノイズを削減します。
- 複数期間 EMA システム: 平均足 EMA は 180 分周期で計算され、60 分周期のより遅い EMA とクロスオーバー信号システムを形成します。
- MACD フィルター: 15 分間の MACD インジケーターを計算して、取引シグナルの有効性を確認します。
- シグナル生成ルール: 高速平均足 EMA が低速 EMA を上回り、MACD インジケーターが確認すると (有効な場合)、ロング シグナルが生成されます。それ以外の場合は、ショート シグナルが生成されます。
戦略的優位性
- 強力な信号の滑らかさ: 平均足ローソク足の平滑化特性により、誤った信号を効果的に減らすことができます。
- 複数の期間の検証: 異なる期間を調整して使用することで、信号の信頼性が向上します。
- 優れたトレンド追跡効果: EMA クロスオーバー システムを通じて中長期のトレンドを効果的に捉えることができます。
- 柔軟なフィルタリング メカニズム: オプションの MACD フィルターにより、追加の信号確認が可能になります。
- 強力なパラメータ調整機能: さまざまな市場特性に応じて複数の主要パラメータを最適化できます。
戦略リスク
- 不安定な市場のリスク: 横ばいで不安定な市場では、誤ったブレイクアウト シグナルが頻繁に発生する可能性があります。
- 遅延リスク: 複数の期間の検証により、エントリーのタイミングがわずかに遅れる可能性があります。
- パラメータの感度: パラメータの組み合わせが異なると、戦略のパフォーマンスに大きな違いが生じる可能性があります。
- 市場環境への依存性: 戦略は強いトレンドの市場ではより良いパフォーマンスを発揮しますが、他の市場環境では良いパフォーマンスを発揮しない可能性があります。
戦略最適化の方向性
- ボラティリティ フィルタリングの追加: 市場のボラティリティを判断するために、ATR やボリンジャー バンドなどの指標を導入します。
- 期間選択の最適化: 特定の取引商品の特性に応じて、期間の組み合わせを調整できます。
- ストップロス メカニズムを改善します。ボラティリティに基づいて、トレーリング ストップロスまたは動的ストップロスを追加します。
- ポジション管理を追加しました: シグナルの強度と市場のボラティリティに基づいてポジション サイズを動的に調整します。
- 市場環境判断の追加: さまざまな市場環境を区別するためにトレンド強度インジケーターを追加します。
要約する
この戦略では、複数の期間の平均足と EMA システムを MACD フィルターと組み合わせて使用し、完全なトレンド追跡取引システムを構築します。戦略設計では、シグナルの信頼性とシステムの安定性が十分に考慮されており、パラメータの最適化とリスク管理メカニズムの改善を通じて、さまざまな市場環境に適応できます。この戦略の主な利点は、信号の滑らかさと複数の検証メカニズムにありますが、同時に、不安定な市場のリスクとパラメータの最適化の問題にも注意を払う必要があります。
Source
Pine
/*backtest
start: 2019-12-23 08:00:00
end: 2025-01-04 08:00:00
period: 1d
basePeriod: 1d
exchanges: [{"eid":"Futures_Binance","currency":"BTC_USDT"}]
*/

// This Pine Script™ code is subject to the terms of the Mozilla Public License 2.0 at https://mozilla.org/MPL/2.0/
// © tradingbauhaus

//@version=5Strategy parameters
Related strategies
Comment
All comments (0)
No data
- 1