動的ランダムパターンに基づく、マルチインジケーターに最適化されたKDJトレンドクロスオーバー戦略取引システム

KDJ RSV SL TP ATR
作成日: 2025-01-06 16:23:38 最終変更日: 2025-01-06 16:23:38
コピー: 1 クリック数: 500
1
フォロー
1617
フォロワー

動的ランダムパターンに基づく、マルチインジケーターに最適化されたKDJトレンドクロスオーバー戦略取引システム

概要

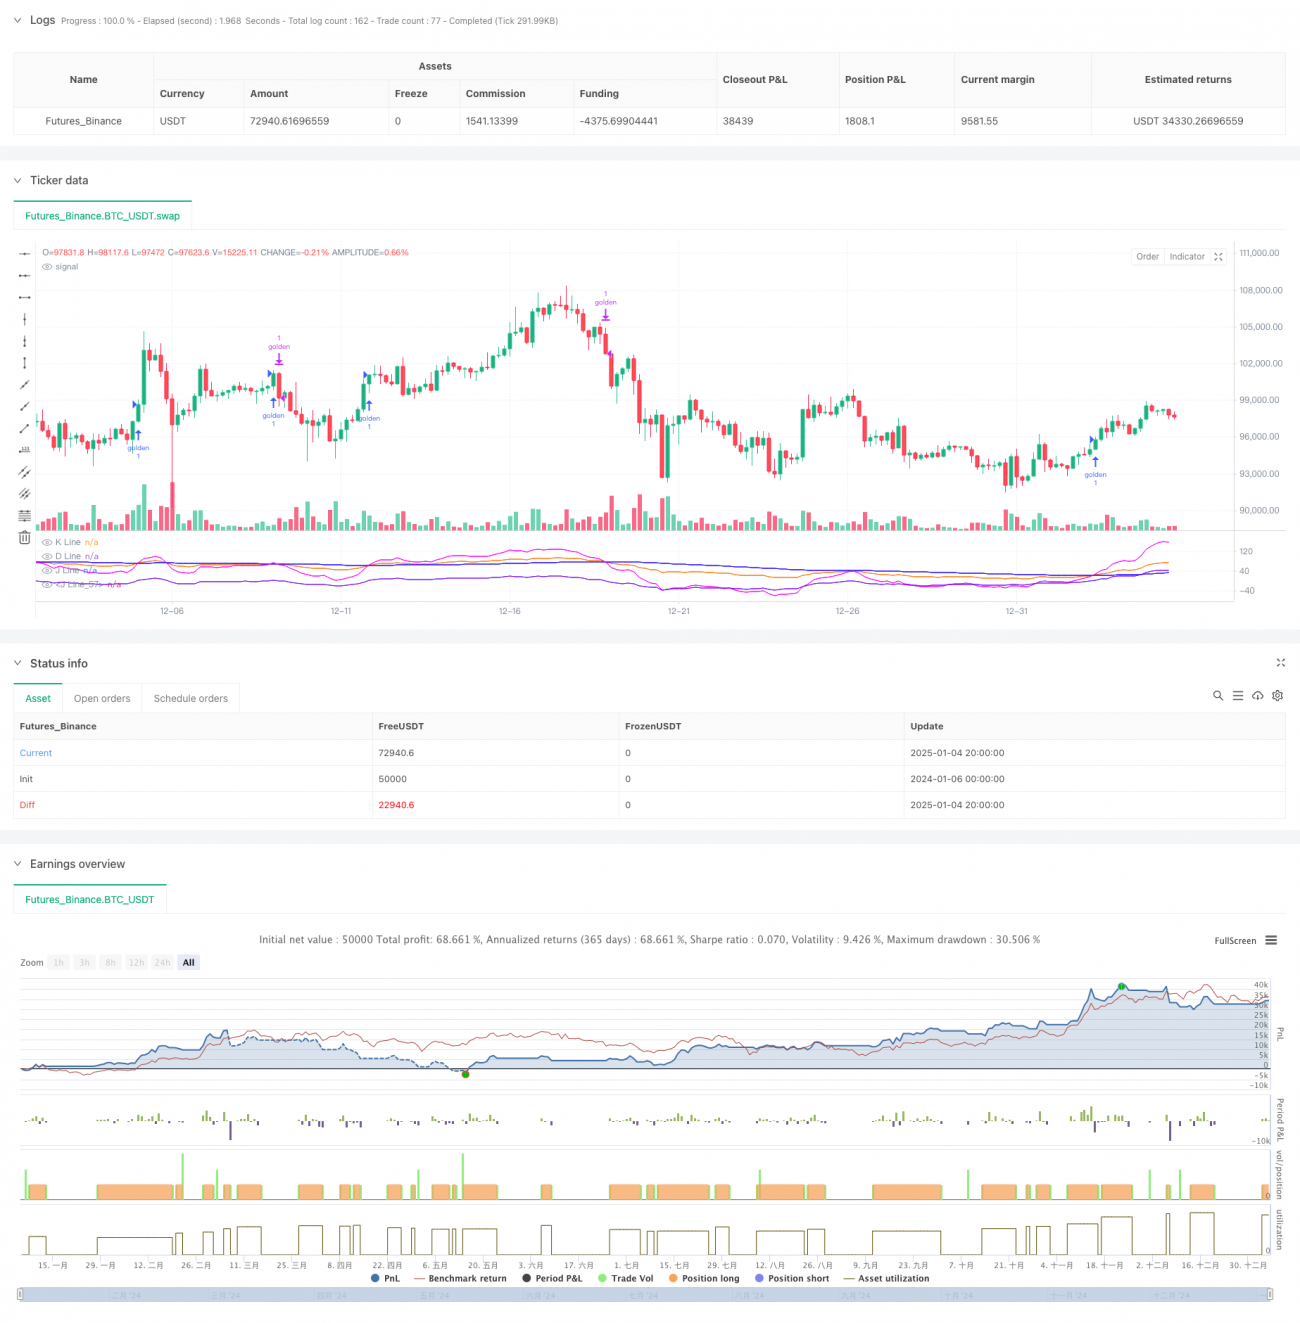
この戦略は、K ライン、D ライン、J ラインのクロスオーバー パターンを詳細に分析して市場の動向を捉える KDJ インジケーターに基づく高度な取引システムです。この戦略は、カスタム BCWSMA 平滑化アルゴリズムを統合し、確率的指標の計算を最適化することで信号の信頼性を向上させます。当システムは、ストップロス機能やトレーリングストップロス機能などの厳格なリスク管理メカニズムを採用し、健全な資金管理を実現します。

戦略原則

戦略の中核となるロジックは、次の主要な要素に基づいています。

  1. KDJ インジケーターは、カスタム BCWSMA (加重移動平均) アルゴリズムを使用して計算され、インジケーターの滑らかさと安定性が向上します。
  2. RSV(未熟乱数)を計算することで、価格は0〜100の範囲の値に変換され、高値と安値の間の価格の位置をより正確に反映します。
  3. 複数の確認を通じて取引シグナルの精度を向上させるために、独自のJラインとJ5ライン(派生指標)のクロス検証メカニズムを設計しました。
  4. 継続性に基づくトレンド確認メカニズムが確立されており、トレンドの有効性を確認するには、J ラインが 3 日連続で D ラインより上に留まる必要があります。
  5. パーセンテージストップロスとトレーリングストップロスを統合した複合リスク管理システム

戦略的優位性

  1. 高度なシグナル生成メカニズム:複数のテクニカル指標のクロス検証により、誤ったシグナルの影響が大幅に軽減されます。
  2. 完璧なリスク管理:固定ストップロスと移動ストップロスを含む多段階のリスク管理メカニズムを採用し、下落リスクを効果的に管理します。
  3. 強力なパラメータ調整機能:KDJサイクル、信号平滑化係数などの主要なパラメータは、市場の状況に応じて柔軟に調整できます。
  4. 高い計算効率: 最適化されたBCWSMAアルゴリズムを使用すると、計算の複雑さが軽減され、戦略実行の効率が向上します。
  5. 優れた適応性: さまざまな市場環境に適応し、パラメータ調整を通じて戦略のパフォーマンスを最適化できます。

戦略リスク

  1. 不安定な市場のリスク: 不安定な市場では、誤ったブレイクアウトシグナルが頻繁に発生し、取引コストが増加する可能性があります。
  2. 遅延リスク: 移動平均平滑化を使用しているため、信号はある程度遅れる可能性があります。
  3. パラメータの感度: 戦略の効果はパラメータ設定に敏感です。パラメータ設定が不適切だと、戦略の効果が大幅に低下する可能性があります。
  4. 市場環境への依存性: 特定の市場環境では、戦略のパフォーマンスが理想的でない場合があります。

戦略最適化の方向性

  1. シグナルフィルタリングメカニズムの最適化:取引量やボラティリティなどの補助指標を導入して、シグナルの信頼性を向上させることができます。
  2. 動的パラメータ調整: 市場の変動に応じてKDJパラメータとストップロスパラメータを動的に調整します。
  3. 市場環境の識別: 市場環境に応じて異なる取引戦略を採用するための市場環境判断モジュールを追加します。
  4. 強化されたリスク管理:最大ドローダウン制御やポジション保持時間制限などの追加のリスク管理手段を追加できます。
  5. パフォーマンスの最適化: BCWSMAアルゴリズムをさらに最適化して計算効率を向上

要約する

この戦略は、テクニカル指標と厳格なリスク管理の革新的な組み合わせを通じて、完全な取引システムを構築します。この戦略の主な利点は、複数のシグナル確認メカニズムと完璧なリスク管理システムにありますが、パラメータの最適化や市場環境への適応性などの問題にも注意を払う必要があります。継続的な最適化と改善を通じて、この戦略はさまざまな市場環境において安定したパフォーマンスを維持することが期待されます。

ストラテジーソースコード
/*backtest
start: 2024-01-06 00:00:00
end: 2025-01-05 00:00:00
period: 4h
basePeriod: 4h
exchanges: [{"eid":"Futures_Binance","currency":"BTC_USDT"}]
*/

// This Pine Script™ code is subject to the terms of the Mozilla Public License 2.0 at https://mozilla.org/MPL/2.0/
// © hexu90

//@version=6

// Date Range
// STEP 1. Create inputs that configure the backtest's date range
useDateFilter = input.bool(true, title="Filter Date Range of Backtest",
     group="Backtest Time Period")
backtestStartDate = input(timestamp("1 Jan 2020"), 
     title="Start Date", group="Backtest Time Period",
     tooltip="This start date is in the time zone of the exchange " + 
     "where the chart's instrument trades. It doesn't use the time " + 
     "zone of the chart or of your computer.")
backtestEndDate = input(timestamp("15 Dec 2024"),
     title="End Date", group="Backtest Time Period",
     tooltip="This end date is in the time zone of the exchange " + 
     "where the chart's instrument trades. It doesn't use the time " + 
     "zone of the chart or of your computer.")
// STEP 2. See if current bar falls inside the date range
inTradeWindow = true

//KDJ strategy
// indicator("My Customized KDJ", shorttitle="KDJ")
strategy("My KDJ Strategy", overlay = false)

// Input parameters
ilong = input(90, title="Period")
k_isig = input(3, title="K Signal")
d_isig = input(30, title="D Signal")

// Custom BCWSMA calculation outside the function
bcwsma(source, length, weight) =>
    var float prev = na  // Persistent variable to store the previous value
    if na(prev)
        prev := source  // Initialize on the first run
    prev := (weight * source + (length - weight) * prev) / length
    prev

// Calculate KDJ
c = close
h = ta.highest(high, ilong)
l = ta.lowest(low, ilong)
RSV = 100 * ((c - l) / (h - l))
pK = bcwsma(RSV, k_isig, 1)
pD = bcwsma(pK, d_isig, 1)
pJ = 3 * pK - 2 * pD

pJ1 = 0
pJ2 = 80
pJ5 = (pJ-pK)-(pK-pD)

// Plot the K, D, J lines with colors
plot(pK, color=color.rgb(251, 121, 8), title="K Line")  // Orange
plot(pD, color=color.rgb(30, 0, 255), title="D Line")  // Blue
plot(pJ, color=color.new(color.rgb(251, 0, 255), 10), title="J Line")  // Pink with transparency
plot(pJ5, color=#6f03f3e6, title="J Line")  // Pink with transparency

// Background color and reference lines
// bgcolor(pJ > pD ? color.new(color.green, 75) : color.new(color.red, 75))
// hline(80, "Upper Band", color=color.gray)
// hline(20, "Lower Band", color=color.gray)

// Variables to track the conditions
var bool condition1_met = false
var int condition2_met = 0

// Condition 1: pJ drops below pJ5
if ta.crossunder(pJ, pJ5)
    condition1_met := true
    condition2_met := 0  // Reset condition 2 if pJ drops below pJ5 again

if ta.crossover(pJ, pD)
    condition2_met += 1

to_long = ta.crossover(pJ, pD)


var int consecutiveDays = 0
// Update the count of consecutive days
if pJ > pD
    consecutiveDays += 1
else
    consecutiveDays := 0

// Check if pJ has been above pD for more than 3 days
consPJacrossPD = false
if consecutiveDays > 3
    consPJacrossPD := true

// Entry condition: After condition 2, pJ crosses above pD a second time
// if condition1_met and condition2_met > 1
//     strategy.entry("golden", strategy.long, qty=1000)
//     condition1_met := false  // Reset the conditions for a new cycle
//     condition2_met = 0
// 
if ta.crossover(pJ, pD) 
    // and pD < 40 and consPJacrossPD
    // consecutiveDays == 1
    //  consecutiveDays == 3 and
    strategy.entry("golden", strategy.long, qty=1)

// to_short = 
// or ta.crossunder(pJ, 100)

// Exit condition
if ta.crossover(pD, pJ)
    strategy.close("golden", qty = 1)

// Stop loss and trailing profit
trail_stop_pct = input.float(0.5, title="Trailing Stop activation (%)", group="Exit Lonng", inline="LTS", tooltip="Trailing Treshold %")
trail_offset_pct = input.float(0.5, title="Trailing Offset (%)", group="Exit Lonng", inline="LTS", tooltip="Trailing Offset %")
trail_stop_tick = trail_stop_pct * close/100
trail_offset_tick = trail_offset_pct * close/100

sl_pct = input.float(5, title="Stop Loss", group="SL and TP", inline="LSLTP")
// tp_pct = input.float(9, title="Take Profit", group="SL and TP", inline="LSLTP")

long_sl_price = strategy.position_avg_price * (1 - sl_pct/100)
// long_tp_price = strategy.position_avg_price * (1 + tp_pct/100)

strategy.exit('golden Exit', 'golden', stop = long_sl_price)
// trail_points = trail_stop_tick, trail_offset=trail_offset_tick