動的移動平均クロスオーバートレンド追跡戦略とATRリスク管理システムを組み合わせたもの

SMA ATR MA EMA ML
作成日: 2025-01-06 16:27:18 最終変更日: 2025-01-06 16:27:18
コピー: 0 クリック数: 414
1
フォロー
1617
フォロワー

動的移動平均クロスオーバートレンド追跡戦略とATRリスク管理システムを組み合わせたもの

概要

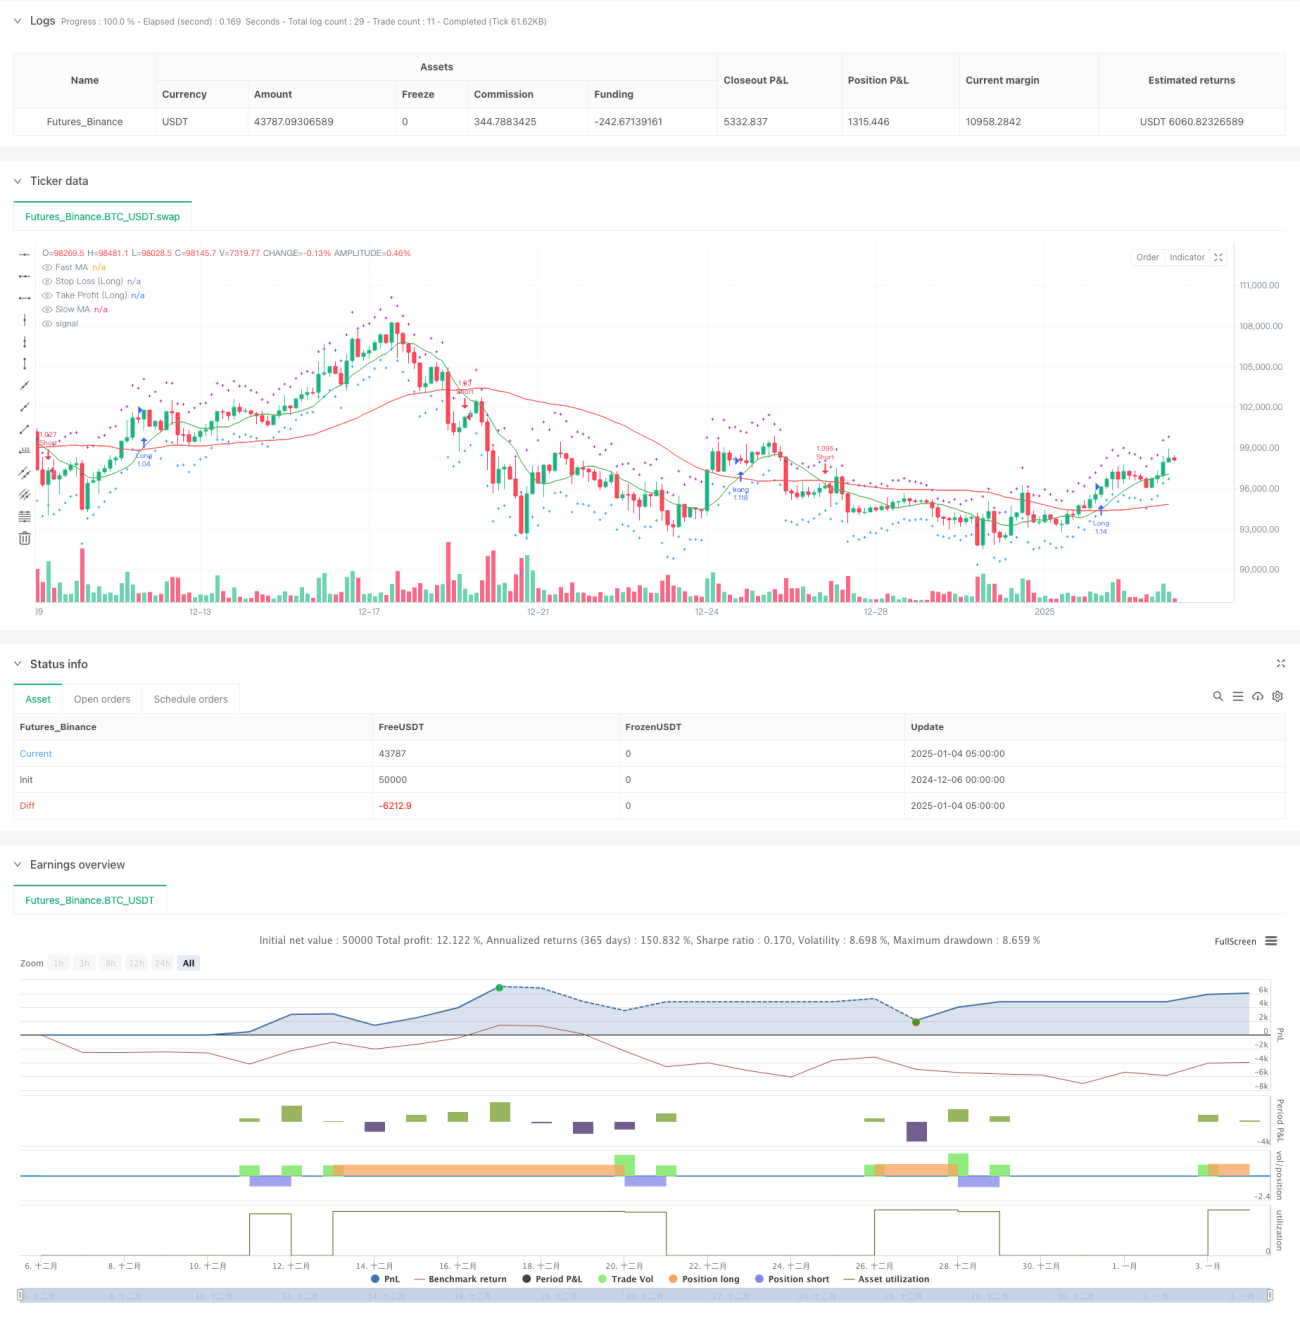
この戦略は、移動平均クロスオーバー信号と ATR リスク管理を組み合わせたトレンド追跡取引システムです。この戦略は、高速移動平均と低速移動平均のクロスオーバーを通じて市場の動向を捉え、ATR インジケーターを使用してストップロスと利益レベルを動的に調整し、取引リスクを正確に制御します。この戦略には、口座の資産と事前に設定されたリスク パラメータに基づいてポジション サイズを自動的に調整する資金管理モジュールも含まれています。

戦略原則

戦略の中核となるロジックは、次の主要な要素に基づいています。

  1. トレンド識別システム - 10 期間と 50 期間の単純移動平均 (SMA) のクロスオーバーを使用してトレンドの方向を決定します。高速移動平均が低速移動平均を上回るとロングシグナルが生成され、下回るとショートシグナルが生成されます。
  2. リスク管理システム - 14 期間の ATR インジケーターを 1.5 倍にして、動的なストップロスと利益目標を設定します。このアプローチでは、市場のボラティリティに基づいてリスク管理パラメータを自動的に調整できます。
  3. 資金管理システム - リスク許容度(2%)と資金配分比率(100%)を設定して、各取引に使用される資金の量を制御し、資金使用の合理性を確保します。

戦略的優位性

  1. 強力な適応性 - ATR を通じてストップロスと利益レベルを動的に調整し、戦略がさまざまな市場環境に適応できるようにします。
  2. 完璧なリスク管理 - パーセンテージリスク管理と ATR ダイナミックストップロスを組み合わせて、二重のリスク保護メカニズムを形成します。
  3. 明確な運用ルール - エントリーとエグジットの条件が明確で、実行とバックテストが簡単です。
  4. 科学的な資金管理 - 比例配分メカニズムを通じて、単一取引のリスクが制御可能であることを保証します。

戦略リスク

  1. 不安定な市場のリスク - 横ばいで不安定な市場では、移動平均のクロスオーバー信号が頻繁に発生し、継続的なストップロスにつながる可能性があります。
  2. スリッページリスク - 市場が急激に変動すると、実際の取引価格がシグナル価格から大きく逸脱する可能性があります。
  3. 資金効率リスク - 資金配分比率が 100% の場合、資金の使用が非効率的になる可能性があります。

戦略最適化の方向性

  1. トレンド フィルターを追加 - ADX などのトレンド強度インジケーターを追加して、トレンドが強い場合にのみ取引を実行します。
  2. 移動平均パラメータを最適化 - 履歴データ テストを使用して、最適な移動平均期間の組み合わせを見つけます。
  3. 資金管理の改善 - アカウントの損益状況に応じて取引サイズを自動的に調整する動的ポジション調整メカニズムを追加することをお勧めします。
  4. 市場環境フィルターを追加 - 市場環境が適切な場合にのみ取引するためにボラティリティ指標を追加します。

要約する

この戦略は、移動平均クロスオーバーを通じてトレンドを捉え、それを ATR 動的リスク制御と組み合わせて、完全なトレンド追跡取引システムを実現します。この戦略の強みは適応性とリスク管理能力にありますが、不安定な市場ではパフォーマンスが低下する可能性があります。トレンド フィルターを追加し、資金管理システムを最適化することで、戦略の全体的なパフォーマンスを向上させることができます。

ストラテジーソースコード
/*backtest
start: 2024-12-06 00:00:00
end: 2025-01-04 08:00:00
period: 3h
basePeriod: 3h
exchanges: [{"eid":"Futures_Binance","currency":"BTC_USDT"}]
*/

// This Pine Script™ code is subject to the terms of the Mozilla Public License 2.0 at https://mozilla.org/MPL/2.0/
// © davisash666

//@version=5
strategy("Trend-Following Strategy", overlay=true)

// Inputs for strategy parameters
timeframe = input.timeframe("D", "Timeframe")
risk_tolerance = input.float(2.0, "Risk Tolerance (%)", step=0.1) / 100
capital_allocation = input.float(200, "Capital Allocation (%)", step=1) / 100

// Technical indicators (used to emulate machine learning)
ma_length_fast = input.int(10, "Fast MA Length")
ma_length_slow = input.int(50, "Slow MA Length")
atr_length = input.int(14, "ATR Length")
atr_multiplier = input.float(1.5, "ATR Multiplier")

// Calculations
fast_ma = ta.sma(close, ma_length_fast)
slow_ma = ta.sma(close, ma_length_slow)
atr = ta.atr(atr_length)

// Entry and exit conditions
long_condition = ta.crossover(fast_ma, slow_ma)
short_condition = ta.crossunder(fast_ma, slow_ma)

// Risk management
stop_loss_long = close - (atr * atr_multiplier)
stop_loss_short = close + (atr * atr_multiplier)
take_profit_long = close + (atr * atr_multiplier)
take_profit_short = close - (atr * atr_multiplier)

// Capital allocation
position_size = strategy.equity * capital_allocation

// Execute trades
if long_condition
    strategy.entry("Long", strategy.long, qty=position_size / close)
    strategy.exit("Take Profit/Stop Loss", "Long", stop=stop_loss_long, limit=take_profit_long)

if short_condition
    strategy.entry("Short", strategy.short, qty=position_size / close)
    strategy.exit("Take Profit/Stop Loss", "Short", stop=stop_loss_short, limit=take_profit_short)

// Plotting for visualization
plot(fast_ma, color=color.green, title="Fast MA")
plot(slow_ma, color=color.red, title="Slow MA")
plot(stop_loss_long, color=color.blue, title="Stop Loss (Long)", linewidth=1, style=plot.style_cross)
plot(take_profit_long, color=color.purple, title="Take Profit (Long)", linewidth=1, style=plot.style_cross)