# マルチタイムフレーム日足ローソク足パターンシグナル取引戦略

1
Follow
1791
Followers
概要
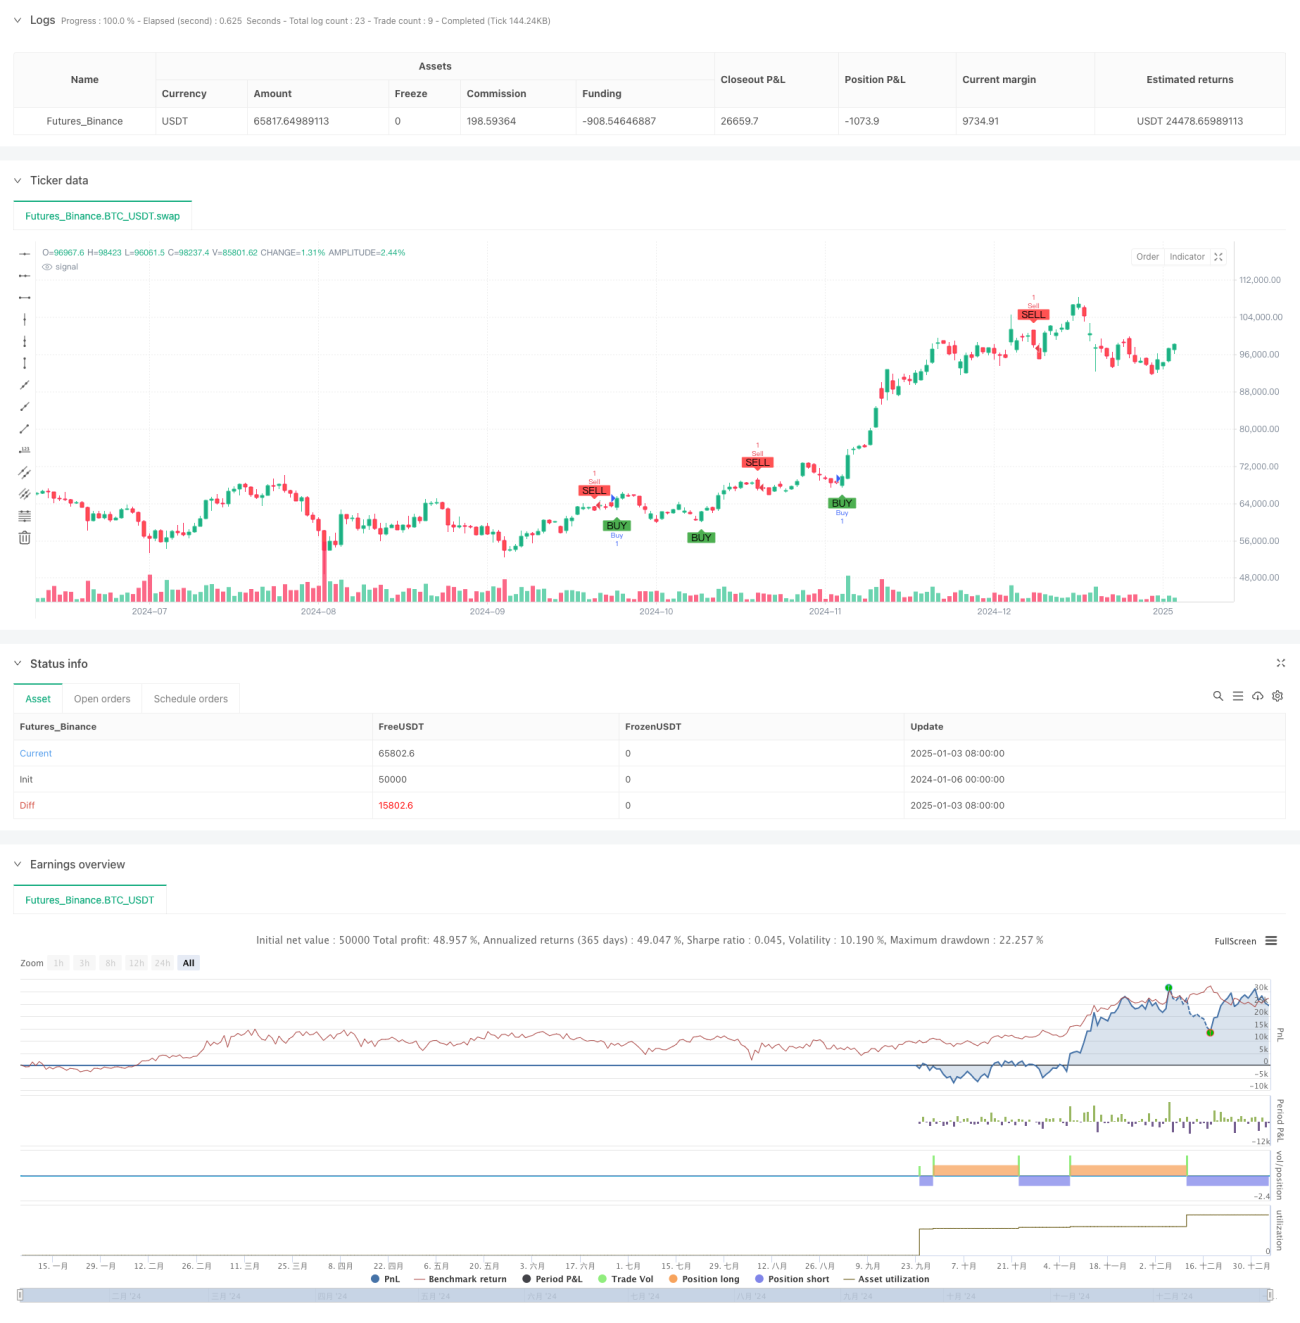
本戦略は、マルチタイムフレームのローソク足パターン分析に基づくトレード戦略であり、主に買い包み、売り包み、十字線などの代表的なローソク足パターンを識別してトレードシグナルを生成します。戦略は日足時間軸で実行され、複数のテクニカル指標とパターン特性を組み合わせて市場のトレンド転換点を特定し、理想的なエントリータイミングを見つけます。
戦略の原理
戦略の核となるロジックは、プログラム化された方法で以下の3つの古典的なローソク足パターンを識別することです。
- 買い包みパターン:前のローソク足が陰線で、現在のローソク足が陽線であり、かつ前のローソク足を完全に包み込む。
- 売り包みパターン:前のローソク足が陽線で、現在のローソク足が陰線であり、かつ前のローソク足を完全に包み込む。
- 十字線パターン:始値と終値の差が現在のローソク足の実体の高さの10%未満である。
買い包みパターンが識別された場合、ローソク足の下に買いシグナルを表示し、売り包みパターンが識別された場合、ローソク足の上に売りシグナルを表示し、十字線パターンが識別された場合、ローソク足の上部にマークを付与します。戦略はlabel.new()関数を使用してシグナルをラベリングし、plotshape()関数でシグナルの視覚効果を強化します。
戦略の利点
- 明確なシグナル:厳密な数学的定義によりローソク足パターンを識別し、主観的判断を排除。
- 視覚性が高い:異なる色や形状で各シグナルをラベリングし、直感的でわかりやすい。
- リスク管理可能:成熟したテクニカル分析理論に基づき、理論的基盤がしっかりしている。
- 通知が迅速:トレードシグナルアラート機能を統合し、自動警告が可能。
- パラメータの柔軟性:シグナルの時間軸や配色をカスタマイズ可能。
戦略のリスク
- 遅延リスク:ローソク足パターンの確定には終値を待つ必要があり、最適なエントリータイミングを逃す可能性がある。
- 偽ブレイクアウトリスク:ローソク足パターンにのみ依存すると、偽のシグナルが発生する可能性がある。
- 市場環境リスク:レンジ相場では過剰なトレードシグナルが発生する可能性がある。
- パラメータ感度:十字線の判定しきい値の設定が不適切だと、シグナルの品質に影響を与える。
戦略の最適化方向
- 出来高指標の導入:出来高の変化を組み合わせてパターンの有効性を検証。
- トレンドフィルターの追加:移動平均線などのトレンド指標を追加し、逆張りシグナルをフィルタリング。
- シグナル確定の最適化:多重確定メカニズムを設計し、シグナルの信頼性を向上。
- リスク管理モジュールの充実:ストップロス・利確機能を追加し、資金管理を最適化。
- パターンライブラリの拡張:さらに多くの古典的なローソク足パターンの識別を追加。
まとめ
本戦略はプログラム化された方法で古典的なローソク足パターン分析を実現し、操作性と拡張性に優れています。適切なパラメータ設定とリスク管理により、トレード判断に有益な参考情報を提供できます。今後はさらに多くのテクニカル指標を追加し、シグナル確定メカニズムを最適化することで、戦略の安定性と信頼性を高めることが可能です。
Source
Pine
Strategy parameters
Related strategies
Comment
All comments (0)
No data
- 1