リスク管理システムと組み合わせたデュアルテクニカル指標モメンタム反転取引戦略

RSI BB RR SMA
作成日: 2025-01-06 16:45:01 最終変更日: 2025-01-06 16:45:01
コピー: 4 クリック数: 397
1
フォロー
1617
フォロワー

リスク管理システムと組み合わせたデュアルテクニカル指標モメンタム反転取引戦略

概要

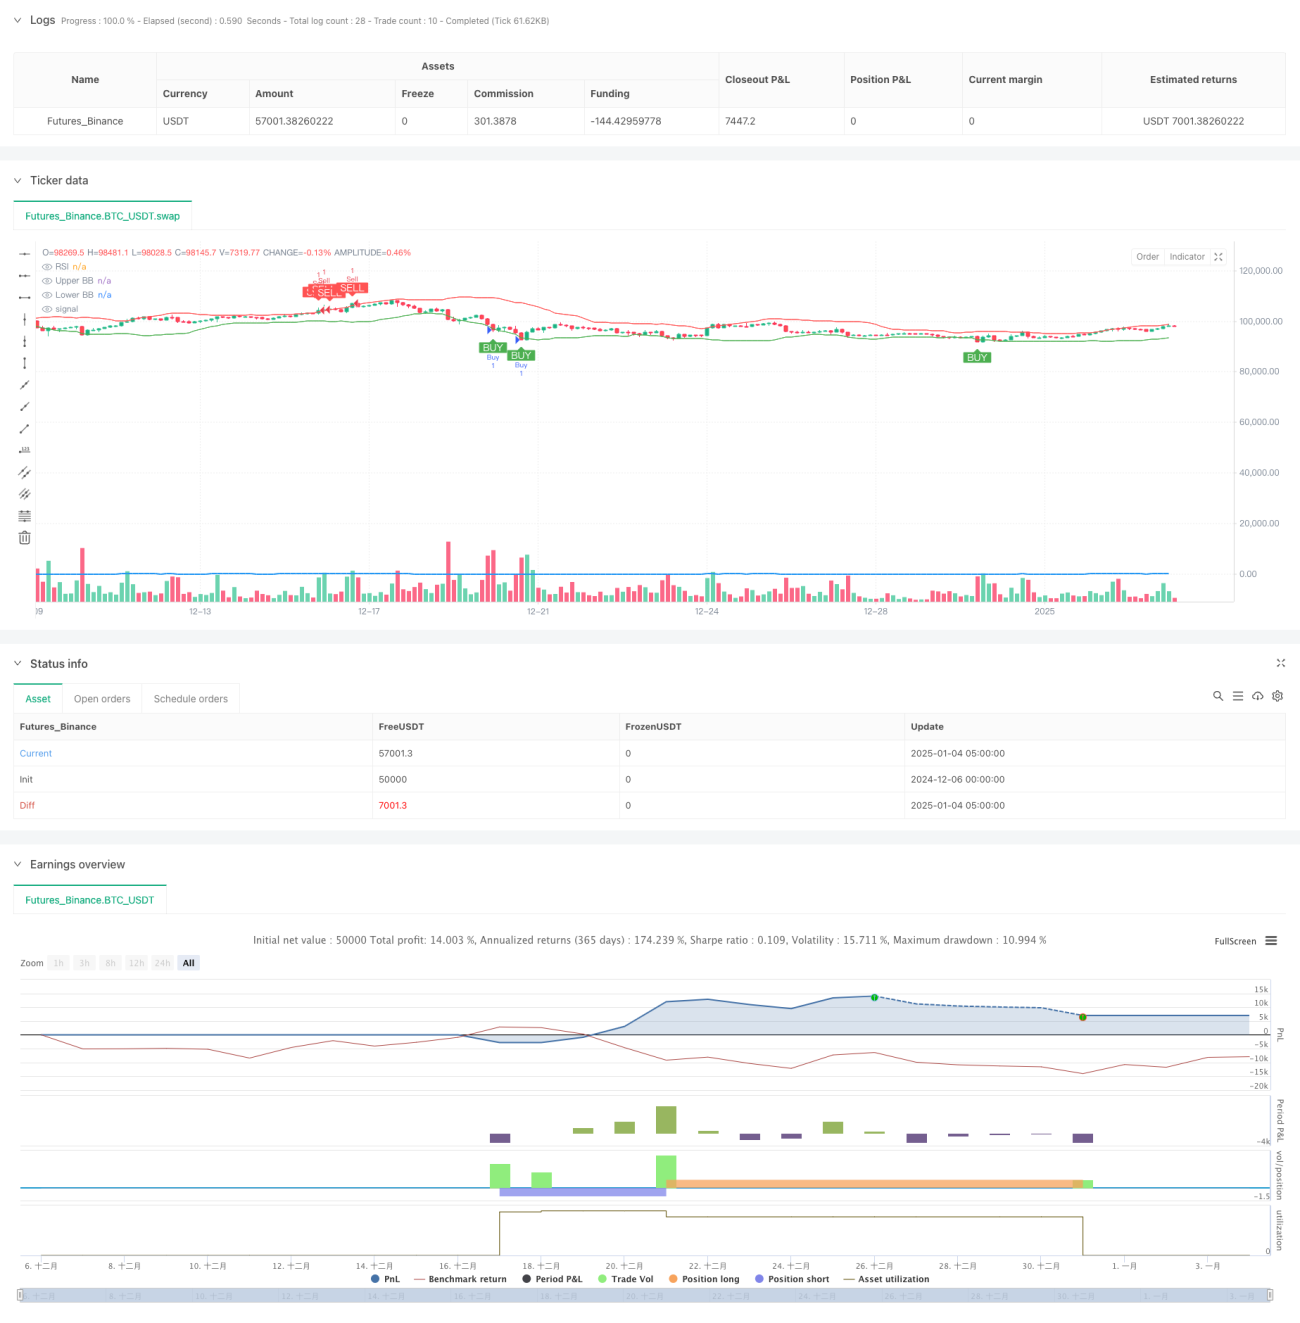
この戦略は、RSI とボリンジャー バンドの 2 つのテクニカル指標を組み合わせて、買われすぎと売られすぎの領域を特定して取引する、モメンタム反転取引システムです。この戦略では、1:2 のリスク リターン比率を使用し、リスク管理のために移動ストップ ロスを組み合わせます。基本的なロジックは、RSI とボリンジャー バンドの両方が同時に買われすぎまたは売られすぎのシグナルを示しているときに取引し、厳格なリスク管理を通じて資金を保護することです。

戦略原則

この戦略では、14 期間の RSI と 20 期間のボリンジャー バンドを主な指標として使用します。購入条件は、RSI が 30 未満 (売られすぎ) であり、価格がボリンジャー バンドの下限に達するか、それを下回るという条件が同時に満たされている必要があります。売り条件は同時に満たされている必要があります: RSI が 70 を超え (買われすぎ)、価格がボリンジャー バンドの上限に達するかそれを上回ります。このシステムは、5 つの K ラインの最高/最低点を移動ストップロスとして使用し、利益確定ポジションはストップロス距離の 2 倍であり、1:2 のリスク リターン比率を厳密に実装しています。

戦略的優位性

  1. デュアルテクニカルインデックスフィルタリングにより信号品質が向上し、誤った信号が削減されます。
  2. モメンタムとボラティリティの指標を組み合わせて、より包括的な市場の見通しを提供します
  3. トレーリングストップロスや固定リスクリターン比率を含む厳格なリスク管理メカニズム
  4. このシステムは人間の感情的な干渉を排除するために完全に自動化されている。
  5. 戦略ロジックは明確で、理解しやすく、維持しやすい

戦略リスク

  1. トレンド市場ではストップロスが頻繁に発生する可能性がある
  2. 二重条件は取引機会を逃す可能性がある
  3. 固定RSIとボリンジャーバンドのパラメータは、すべての市場環境に適しているわけではない。
  4. トレーリングストップは不安定な市場では時期尚早な撤退につながる可能性がある
  5. 連続損失に対処するには合理的な資金管理が必要

戦略最適化の方向性

  1. 市場のボラティリティに応じて指標パラメータを動的に調整する適応パラメータメカニズムを導入する
  2. 強いトレンドでの反転取引を一時停止するトレンドフィルターを追加しました
  3. 動的なリスク・リターン比率システムを開発し、市場状況に応じて調整する
  4. 信号の信頼性を向上させるために音量確認メカニズムを追加
  5. トレーリングストップロスやタイムストップロスなど、より柔軟なストップロスメカニズムを実装する

要約する

これは、精度を高めるために二重のテクニカル指標を使用し、厳格なリスク管理を採用した、よく構成された反転取引戦略です。この戦略はシンプルで直感的ですが、成熟した取引システムに必要な重要な要素が含まれています。提案された最適化の方向性により、この戦略にはさらなる改善の余地があります。実際の取引では、まず十分なバックテストとパラメータの最適化を実施することをお勧めします。

ストラテジーソースコード
/*backtest
start: 2024-12-06 00:00:00
end: 2025-01-04 08:00:00
period: 3h
basePeriod: 3h
exchanges: [{"eid":"Futures_Binance","currency":"BTC_USDT"}]
*/

//@version=5
strategy("RSI + Bollinger Bands with 1:2 Risk/Reward", overlay=true)

// Define Inputs
length_rsi = input.int(14, title="RSI Period")
oversold_level = input.int(30, title="RSI Oversold Level")
overbought_level = input.int(70, title="RSI Overbought Level")
length_bb = input.int(20, title="Bollinger Bands Period")
src = close
risk_to_reward = input.float(2.0, title="Risk-to-Reward Ratio", minval=1.0, step=0.1)

// Calculate Indicators
rsi_value = ta.rsi(src, length_rsi)
basis = ta.sma(src, length_bb)
dev = ta.stdev(src, length_bb)
upper_band = basis + 2 * dev
lower_band = basis - 2 * dev

// Define Buy and Sell Conditions
rsi_buy_condition = rsi_value < oversold_level // RSI below 30 (buy signal)
bollinger_buy_condition = close <= lower_band // Price at or near lower Bollinger Band (buy signal)

rsi_sell_condition = rsi_value > overbought_level // RSI above 70 (sell signal)
bollinger_sell_condition = close >= upper_band // Price at or near upper Bollinger Band (sell signal)

// Combine Buy and Sell Conditions
buy_condition = rsi_buy_condition and bollinger_buy_condition
sell_condition = rsi_sell_condition and bollinger_sell_condition

// Plot Buy and Sell Signals with white text and green/red boxes
plotshape(series=buy_condition, location=location.belowbar, color=color.green, style=shape.labelup, title="Buy Signal", text="BUY", textcolor=color.white, size=size.small)
plotshape(series=sell_condition, location=location.abovebar, color=color.red, style=shape.labeldown, title="Sell Signal", text="SELL", textcolor=color.white, size=size.small)

// Calculate Swing Points (for Stop Loss)
swing_low = ta.lowest(low, 5)  // Last 5 bars' low
swing_high = ta.highest(high, 5) // Last 5 bars' high

// Calculate Risk (Distance from Entry to SL)
long_risk = close - swing_low
short_risk = swing_high - close

// Calculate Take Profit using 1:2 Risk-to-Reward Ratio
take_profit_long = close + 2 * long_risk
take_profit_short = close - 2 * short_risk

// Strategy Execution: Enter Buy/Sell Positions
if buy_condition
    strategy.entry("Buy", strategy.long)
    strategy.exit("Take Profit", "Buy", limit=take_profit_long, stop=swing_low)  // Set TP and SL for Buy

if sell_condition
    strategy.entry("Sell", strategy.short)
    strategy.exit("Take Profit", "Sell", limit=take_profit_short, stop=swing_high)  // Set TP and SL for Sell

// Plotting the Indicators for Visualization (Optional - comment out if not needed)
plot(rsi_value, color=color.blue, title="RSI", linewidth=2, display=display.none)
plot(upper_band, color=color.red, title="Upper BB", display=display.none)
plot(lower_band, color=color.green, title="Lower BB", display=display.none)