複数のテクニカル指標を統合したトレンド追跡定量取引戦略

1
Follow
1780
Followers
概要
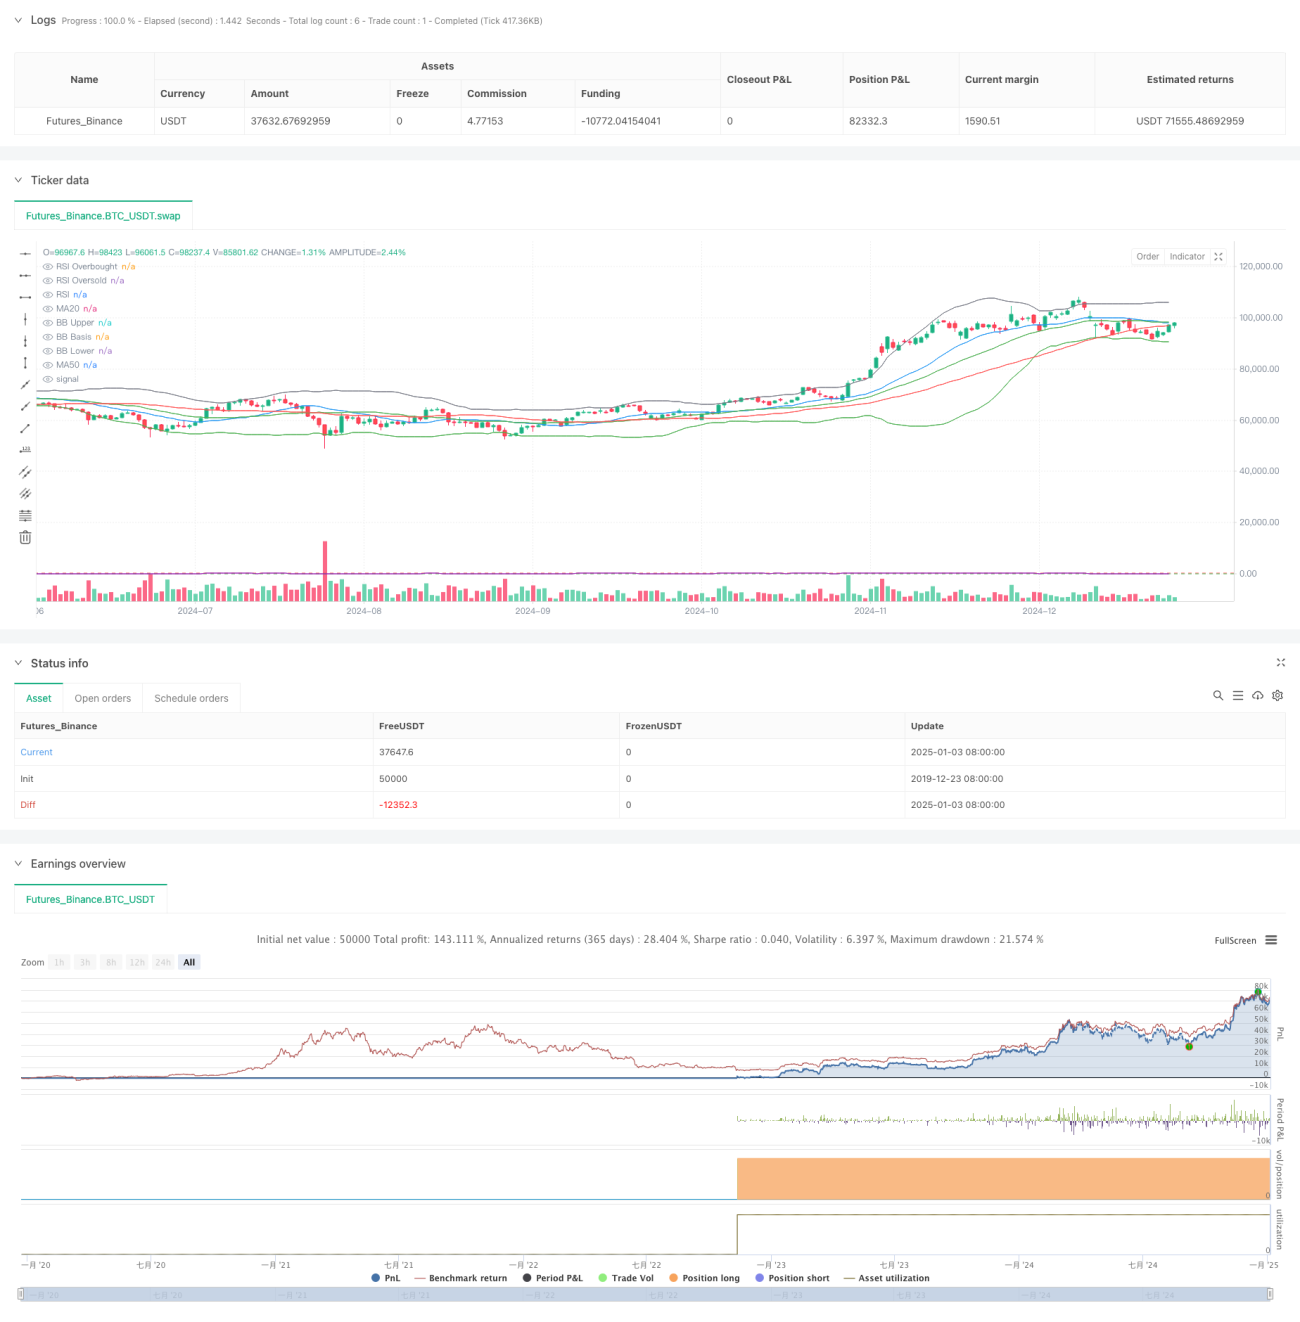
この戦略は、相対力指数 (RSI)、移動平均 (MA)、ボリンジャーバンド (BB) という 3 つの主要なテクニカル指標を統合した定量取引システムです。この戦略は、複数のテクニカル指標の信号を総合的に分析し、市場のトレンドと変動の中で最適な取引機会を見つけます。この戦略は、MA20とMA50のゴールデンクロスとデッドクロスを使用して中期トレンドを判断し、RSIの買われすぎと売られすぎのシグナルとボリンジャーバンドの上限と下限のブレイクスルー回帰を組み合わせて、完全な取引決定を構築します。作成システム。
戦略原則
戦略の中核となるロジックは、次の 3 つの次元に基づいています。
- トレンド判断: MA20 と MA50 のクロス関係を使用して、市場の中期トレンドを判断します。MA20 が MA50 を横切ると上昇トレンドと見なされ、それ以外の場合は下降トレンドと見なされます。
- モメンタム判断:RSIインジケーターを使用して、市場の買われすぎまたは売られすぎの状態を判断します。RSIが25未満の場合は売られすぎの領域に入り、80を超える場合は買われすぎの領域に入ります。
- 変動判定:ボリンジャーバンド(BB30)の上限と下限の線を使って価格変動幅を表します。下限を突破した場合は売られ過ぎ、上限を突破した場合は上昇し過ぎとみなされます。
ロング条件は同時に満たされる必要があります: RSI < 25 (売られすぎ) + MA20 > MA50 (上昇トレンド) + 価格 < ボリンジャーバンドの下方軌道 (売られすぎ)
空売り条件は、RSI>80(買われすぎ)+ MA20<MA50(下降トレンド)+価格>ボリンジャーバンドの上限トラック(上昇しすぎ)という条件を同時に満たす必要があります。
戦略的優位性
- 複数指標の相互検証: トレンド、モメンタム、ボラティリティの 3 つの次元で指標を統合することにより、取引シグナルの信頼性が向上します。
- 完璧なリスク管理: RSI の買われすぎと売られすぎのしきい値が適切に設定されており、誤ったシグナルを効果的に排除できます。
- 強力な適応性: ボリンジャー バンドは市場のボラティリティに応じて適応的に調整できるため、さまざまな市場環境での戦略のパフォーマンスが向上します。
- 強力なパラメータ調整機能: 主要な指標パラメータは、さまざまな市場特性に応じて最適化および調整できます。
戦略リスク
- 遅延リスク: 移動平均には一定の遅延があり、エントリータイミングが遅れる可能性があります。
- 不安定な市場のリスク: 横ばいで不安定な市場では、誤ったシグナルが頻繁に生成される可能性があります。
- トレンド反転リスク: 強いトレンドが突然反転した場合、戦略が間に合わない可能性があります。
- パラメータの感度: パラメータを過度に最適化すると、過剰適合の問題が発生する可能性があります。
戦略最適化の方向性
- ボリュームインジケーターの導入: トレンド判断の精度を向上させるには、ボリューム分析の次元を増やすことをお勧めします。
- ストップロス メカニズムの最適化: ATR に基づく動的ストップロスを設計して、リスク管理機能を向上させることができます。
- 市場環境フィルタリングの強化: 市場のボラティリティ判断を追加し、ボラティリティの高い環境で戦略パラメータを調整します。
- 位置管理の改善: 信号強度に基づいて動的な位置制御システムを設計します。
要約する
この戦略は、複数のテクニカル指標の協調的な連携を通じて、比較的完全な取引システムを構築します。この戦略はトレンドが明確な市場では良好なパフォーマンスを発揮しますが、市場環境の変化に注意し、それに応じた調整を行う必要があります。この戦略は継続的な最適化と改善を通じて、実際の取引で安定した収益を達成することが期待されます。
Source
Pine
Strategy parameters
Related strategies
Comment
All comments (0)
No data
- 1