長期トレンドSMA移動平均クロスオーバー定量戦略

1
Follow
1781
Followers
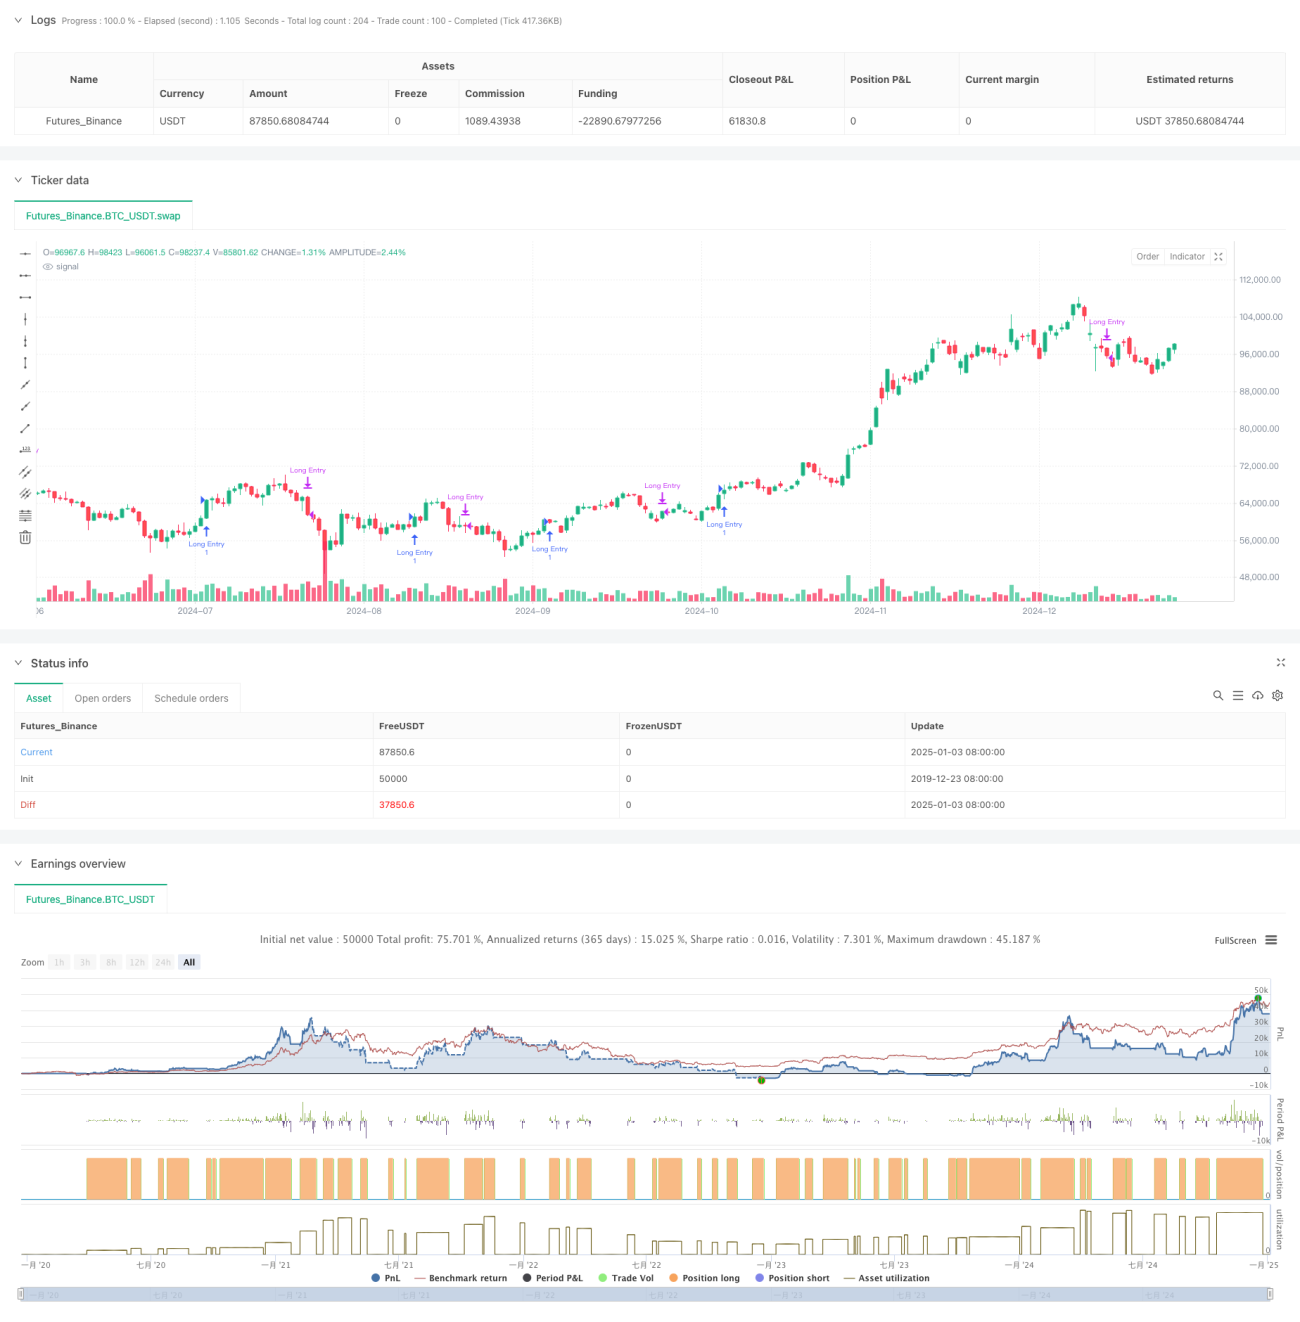
概要
この戦略は、複数期間の単純移動平均 (SMA) クロスオーバー信号に基づく定量取引システムです。主に、長期的な上昇トレンドの中で短期的な引き戻しの機会を特定して取引します。この戦略では、5 日、10 日、20 日、60 日、120 日の 5 つの期間を持つ SMA インジケーターを使用して、移動平均の位置関係とクロスオーバー信号を通じて市場の動向と取引の機会を判断します。
戦略原則
戦略の中核となるロジックには、次の主要な部分が含まれます。
- 長期的なトレンドは、SMA20とSMA60の相対的な位置関係によって判断できます。SMA20がSMA60を上回っている場合、市場は上昇トレンドにあることが確認できます。
- 長期的な上昇トレンドを確認する前提で、短期のSMA5がSMA20を下回ってから上回ったときに買いシグナルが発動されます。これは、市場が上昇トレンドの短期的な後退後に回復していることを示唆しています。
- SMA20 が SMA5 を横切ると、クローズ シグナルがトリガーされます。これは、短期的な上昇の勢いが弱まり、調整期に入る可能性があることを示しています。
- この戦略には時間フィルター機能も含まれており、バックテストの時間範囲を制限し、戦略の柔軟性を向上させることができます。
戦略的優位性
- 戦略ロジックは明確かつシンプルで、理解と実装が容易であり、複雑な計算プロセスを必要としません。
- 複数の期間の移動平均を連携して使用することで、市場のノイズを効果的に除去し、取引シグナルの信頼性を向上させることができます。
- この戦略は、トレンド市場でのプルバックの機会に焦点を当てており、「トレンド取引」のコアコンセプトと一致しています。
- EMA の代わりに SMA を使用すると、価格の変化に対する感度が低下し、誤ったシグナルが減少します。
- エントリーとエグジットのロジックが明確であるため、実行とリスク管理が容易になります。
戦略リスク
- 移動平均システムには遅れがあり、エントリーとエグジットのタイミングが最適でない可能性があります。
- 不安定な市場では、移動平均線のクロスオーバーが頻繁に発生すると、誤ったシグナルが多すぎる可能性があります。
- この戦略にはボラティリティフィルタリングメカニズムがないため、ボラティリティが高い期間にはより大きなドローダウンリスクに直面する可能性があります。
- 取引量などの他のテクニカル指標との連携を考慮せずに、シグナルの信頼性を向上させる必要があります。
- 固定移動平均パラメータは、すべての市場環境に適しているとは限りません。
戦略最適化の方向性
- ボラティリティフィルタリング用の ATR インジケーターを導入し、ボラティリティが高すぎる場合は取引を回避します。
- 取引シグナルの信頼性を向上させるために、ボリューム確認メカニズムを追加します。
- 適応型移動平均サイクル メカニズムを開発して、戦略がさまざまな市場環境により適切に適応できるようにします。
- 強いトレンドでの取引を確実に行うために、ADX インジケーターなどのトレンド強度フィルターを追加します。
- リスクをより適切に管理するために、トレーリングストップの追加など、ストップロスメカニズムを改善します。
要約する
この戦略では、複数期間の SMA 移動平均を使用して、長期的な上昇トレンドでのプルバックの機会を捉えることに重点を置いた取引システムを構築します。戦略設計は簡潔かつ実用的であり、理解しやすく実装しやすいです。ボラティリティフィルタリングやボリューム確認などの最適化策を導入することで、戦略の堅牢性と信頼性がさらに向上することが期待されます。
Source
Pine
/*backtest
start: 2019-12-23 08:00:00
end: 2025-01-04 08:00:00
period: 1d
basePeriod: 1d
exchanges: [{"eid":"Futures_Binance","currency":"BTC_USDT"}]
*/

//@version=6
strategy("Long-Term Growing Stock Strategy", overlay=true)
// Date Range
// STEP 1. Create inputs that configure the backtest's date rangeStrategy parameters
Related strategies
Comment
All comments (0)
No data
- 1