複数の移動平均クロスオーバートレンドフォローRSIボラティリティ戦略

1
Follow
1781
Followers
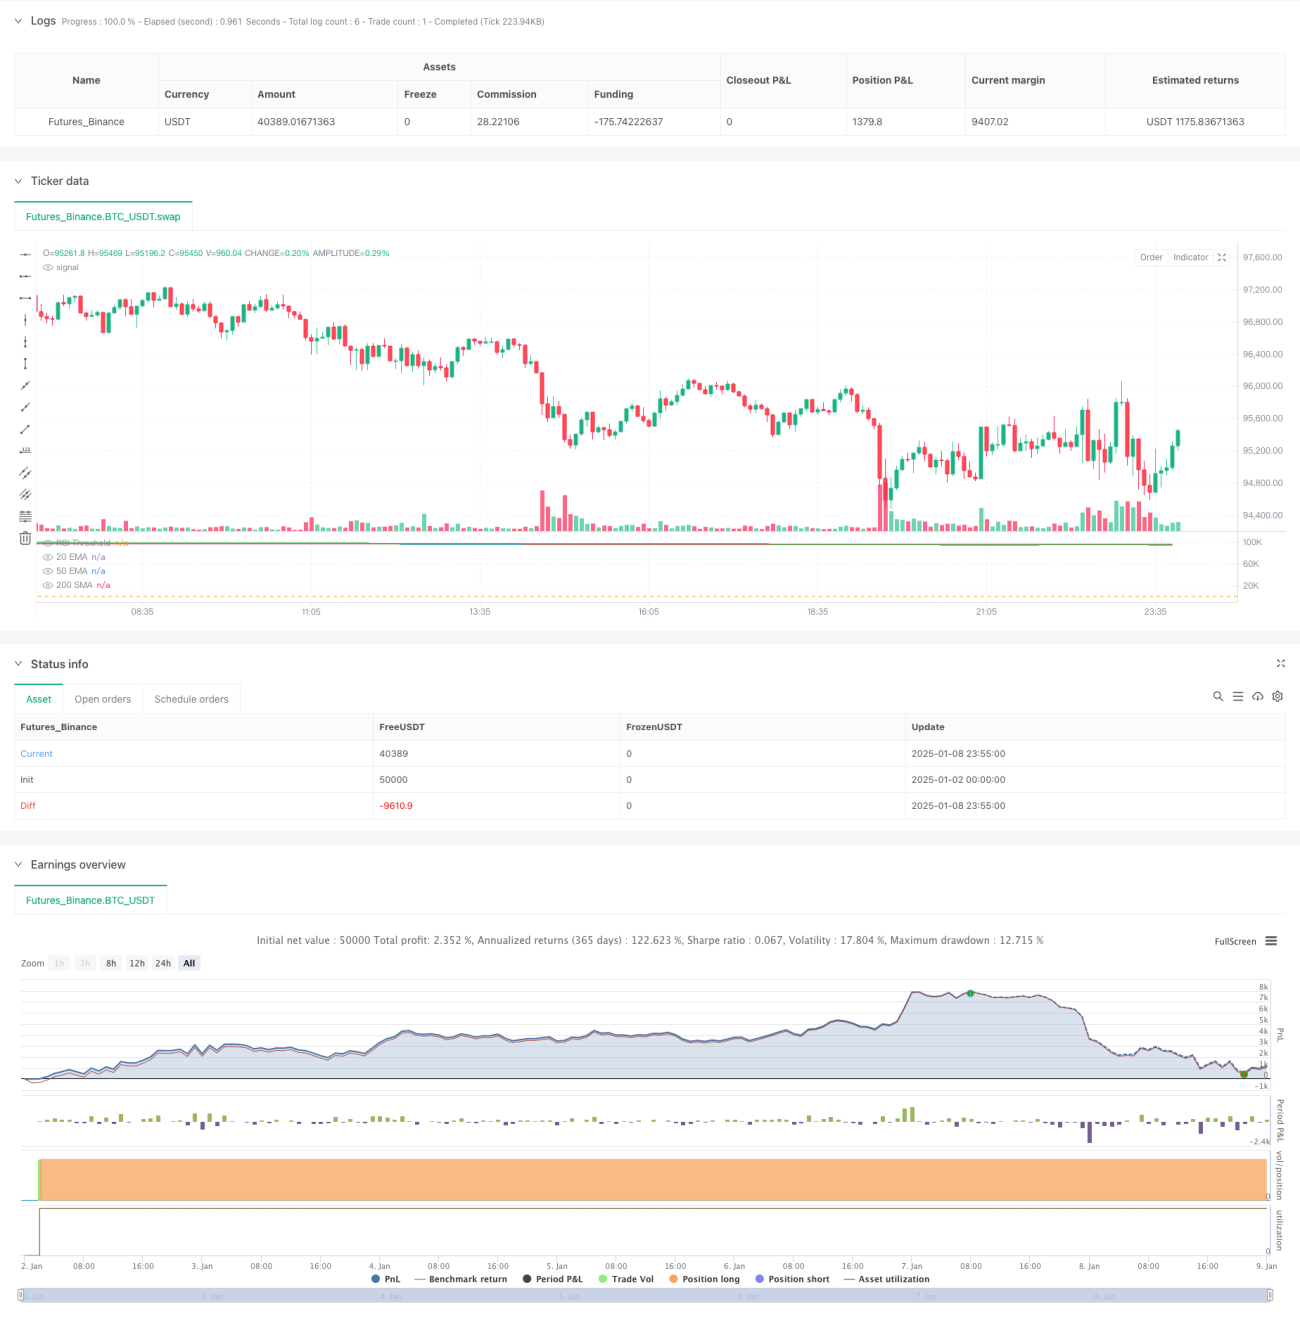
概要
この戦略は、複数の移動平均クロスオーバーと RSI インジケーターに基づいたトレンド追跡取引システムです。この戦略は、EMA20、EMA50、SMA200の3つの移動平均を組み合わせ、移動平均の位置関係で市場の動向を判断し、RSIインジケーターを使用して取引シグナルをフィルタリングし、価格が前回の高値を突破したときに取引します。この戦略は固定の利益確定条件と損切り条件を設定し、1 時間レベルと日次レベルで実行するのに適しています。
戦略原則
戦略の中核となるロジックは、次の主要な条件に基づいています。
- トレンド判断: 上昇トレンドを確保するには、EMA20 が EMA50 より上に、SMA200 が EMA20 と EMA50 より下になければなりません。
- 価格ポジション: 現在の終値は、主要なサポート レベルにあることを確認するために、EMA20 または EMA50 の 1% 以内である必要があります。
- RSI フィルタリング: 強い市場を除外するには、RSI 値が設定されたしきい値 (デフォルトは 40) よりも大きくなければなりません。
- エントリートリガー: 価格が前のローソク足の高値を突破すると、ロングシグナルがトリガーされます。
- リスク管理: リスク管理のために、25% の利益確定レベルと 10% の損切りレベルを設定します。
戦略的優位性
- 多重確認メカニズム: 移動平均システム、RSI インジケーター、価格ブレイクスルーなどの複数の次元を通じて取引シグナルを確認し、誤ったシグナルを減らします。
- 強力なトレンド追跡: 複数の移動平均システムを使用して中期および長期のトレンドを決定し、取引方向の精度を向上させます。
- 完璧なリスク管理: 固定の利益確定比率と損切り比率を設定して、各取引のリスクを効果的に管理します。
- 優れた適応性: 戦略パラメータは、さまざまな市場環境に適応するように調整可能です。
- 明確な実行: 開始条件と終了条件は明確で、プログラムで簡単に実装できます。
戦略リスク
- 不安定な市場のリスク: 横ばいで不安定な市場では、誤ったシグナルが頻繁に生成される可能性があります。
- 遅延リスク: 移動平均システムには一定の遅延があり、最適なエントリー機会を逃す可能性があります。
- ストップロスマージンリスク: 固定ストップロス比率は、すべての市場状況に適切であるとは限りません。
- ドローダウンリスク: トレンドが反転すると大きなドローダウンが発生する可能性があります。
戦略最適化の方向性
- 動的パラメータ最適化: 市場のボラティリティに応じて移動平均期間と RSI しきい値を動的に調整します。
- 市場環境の識別: 市場環境の判断メカニズムを追加し、さまざまな市場環境でさまざまなパラメータの組み合わせを使用します。
- 動的な利益確定と損失確定: ATR またはボラティリティに基づいて、動的な利益確定と損失確定のレベルを設定します。
- ボリューム分析を追加: ボリュームインジケーターと組み合わせて、信号の信頼性を向上させます。
- 終了メカニズムの最適化: 収益性を向上させるために、より柔軟な終了メカニズムを設計します。
要約する
この戦略は、完全な構造と明確なロジックを備えたトレンド追跡システムです。複数のテクニカル指標を連携して使用することで、市場の動向を効果的に捉えるとともに、完全なリスク管理メカニズムも実現します。戦略には最適化の余地が大きく、継続的な改善により戦略の安定性と収益性がさらに高まります。中期および長期のトレーダーにとって、これは試してみる価値のある戦略フレームワークです。
Source
Pine
Strategy parameters
Related strategies
Comment
All comments (0)
No data
- 1