高頻度の価格とボリュームのトレンド追跡とボリューム分析適応戦略

1
Follow
1781
Followers
概要
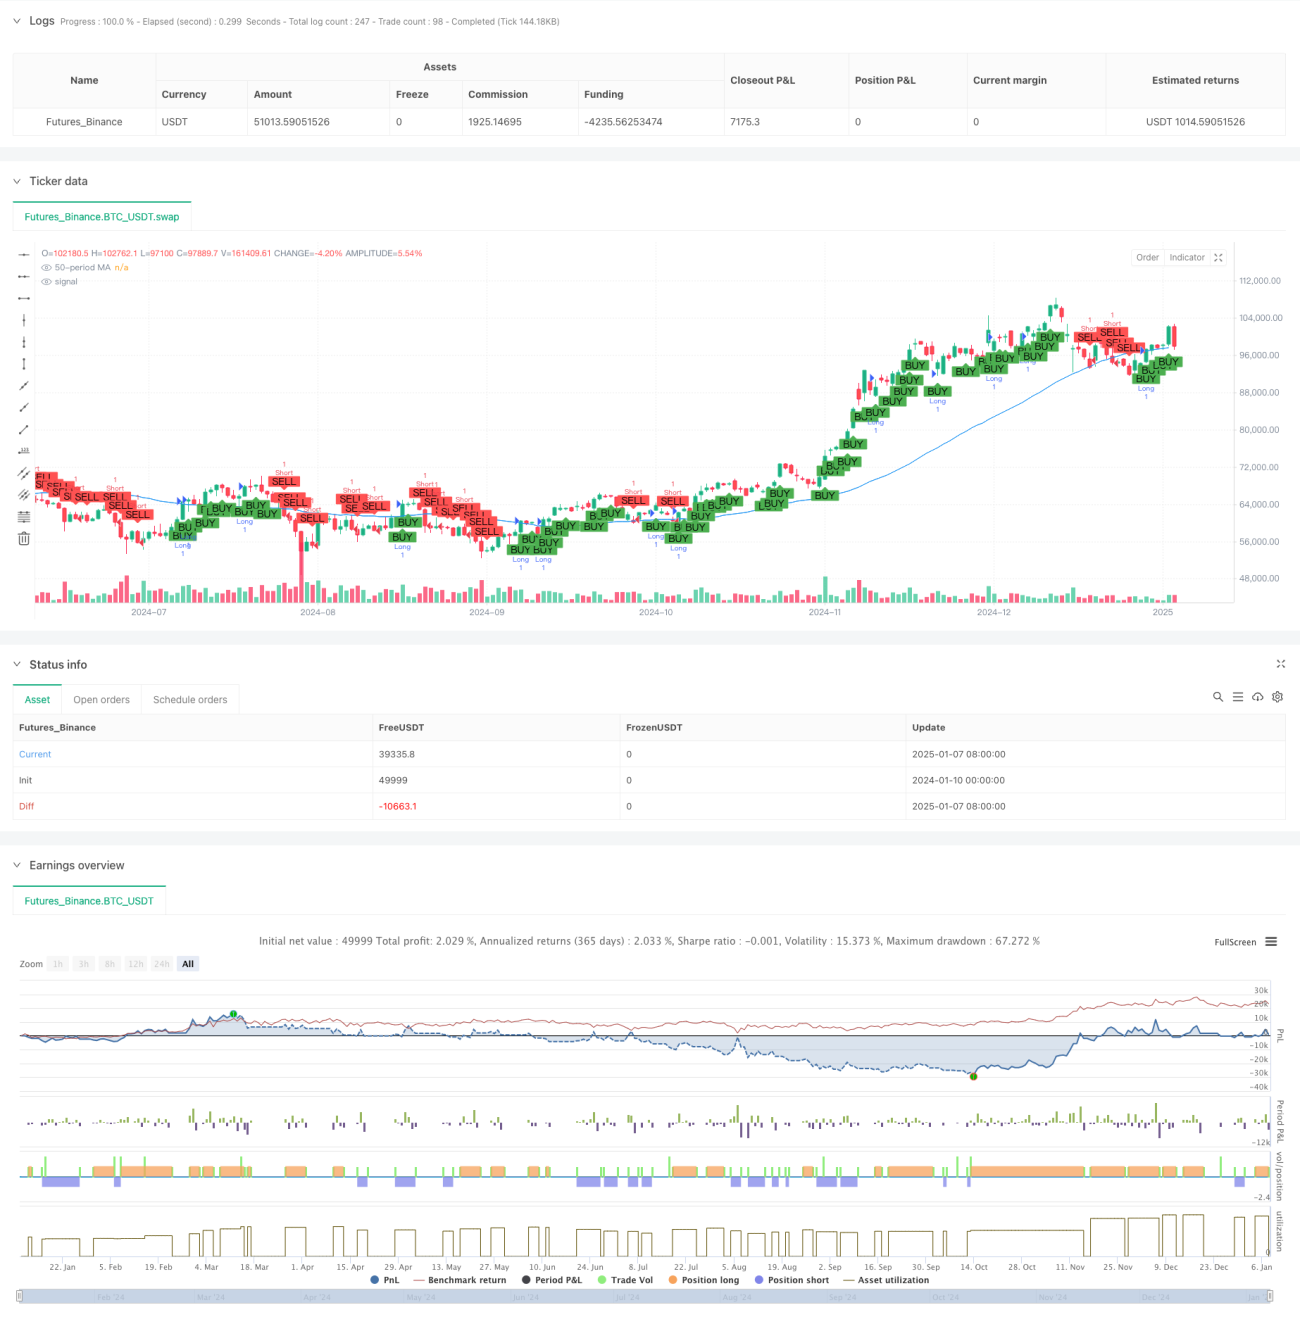
この戦略は、移動平均トレンド追跡とボリューム分析手法を組み合わせた 5 分間の時間枠に基づく自動取引システムです。この戦略では、50 期間の単純移動平均 (SMA) を使用して市場の動向を判断し、取引シグナルの有効性を検証するためにボリューム分析を導入します。このシステムは、固定のストップロスと利益目標を使用して、完全に自動化された取引を実現します。
戦略原則
戦略の中核となるロジックには、次の主要なコンポーネントが含まれます。
- トレンドの識別: 50 期間の SMA を使用して市場の方向を判断します。終値が移動平均よりも高い場合は上昇トレンドと見なされ、そうでない場合は下降トレンドと見なされます。同時に、過去 30 分間の価格動向 (6 つの K ライン) を組み合わせてトレンドを確認します。
- ボリューム分析:価格変動に基づいて買いボリュームと売りボリュームを計算し、各 K ライン内のボリュームを終値の位置に応じて買いボリュームと売りボリュームに割り当てます。
- 取引シグナルの生成: 上昇トレンドでは、買い量が売り量よりも多い場合にロング シグナルが生成されます。下降トレンドでは、売り量が買い量よりも多い場合にショート シグナルが生成されます。
- リスク管理: 3% のストップロスと 29% の利益目標を使用して、各取引のリスク報酬比率を管理します。
戦略的優位性
- 多次元トレンド確認:移動平均と短期価格トレンドを組み合わせてトレンドを二重に確認することで、トレンド判断の精度が向上します。
- ボリューム検証: ボリュームの少ない環境での誤ったブレイクアウトを回避するために、取引シグナル フィルターとしてボリューム分析を導入します。
- 完璧なリスク管理: 明確なストップロスと利益目標を設定して、単一取引のリスクを効果的に管理します。
- 強力な適応性: この戦略は、市場の状況に応じて取引の方向を自動的に調整し、さまざまな市場環境に適応できます。
戦略リスク
- 不安定な市場のリスク: 横ばいで不安定な市場では、誤ったブレイクアウト シグナルが頻繁に発生し、継続的なストップ ロスにつながる可能性があります。
- スリッページリスク: 高頻度取引では大きなスリッページが発生する可能性があり、実際の執行効果に影響を及ぼします。
- パラメータ感度: 戦略の効果は、移動平均期間や取引量計算期間などのパラメータに敏感です。
- 市場環境への依存: この戦略は明確なトレンドのある市場では良好なパフォーマンスを発揮しますが、トレンドの移行期間中に大きなドローダウンが発生する可能性があります。
戦略最適化の方向性
- 動的パラメータ最適化: 適応パラメータメカニズムを導入して、市場のボラティリティに応じて移動平均期間と取引量計算期間を動的に調整できます。
- 市場環境フィルタリングの強化: ボラティリティ指標またはトレンド強度指標を追加して、不適切な市場状況での取引を自動的に停止します。
- ストップロス メカニズムの改善: トレーリング ストップロスや ATR ベースのストップロスなどの動的ストップロスを使用すると、リスク管理の柔軟性を高めることができます。
- シグナル生成ロジックを最適化します。シグナルの信頼性を向上させるために、クロス検証用のテクニカル指標をさらに追加することを検討してください。
要約する
この戦略は、トレンド追跡とボリューム分析を組み合わせて、完全な高頻度取引システムを構築します。この戦略の主な利点は、多次元のシグナル確認メカニズムと完璧なリスク管理システムにあります。いくつかの固有のリスクはあるものの、提案された最適化の方向性を通じて、戦略の安定性と適応性をさらに向上させることができます。この戦略は、明確なトレンドのある市場環境での運用に特に適しており、合理的なパラメータ最適化とリスク管理を通じて安定した取引結果を達成することが期待されます。
Source
Pine
/*backtest
start: 2024-01-10 00:00:00
end: 2025-01-08 08:00:00
period: 1d
basePeriod: 1d
exchanges: [{"eid":"Futures_Binance","currency":"BTC_USDT","balance":49999}]
*/

// This Pine Script™ code is subject to the terms of the Mozilla Public License 2.0 at https://mozilla.org/MPL/2.0/
// © Jerryorange

//@version=6Strategy parameters
Related strategies
Comment
All comments (0)
No data
- 1