
1
Follow
1802
Followers
概要
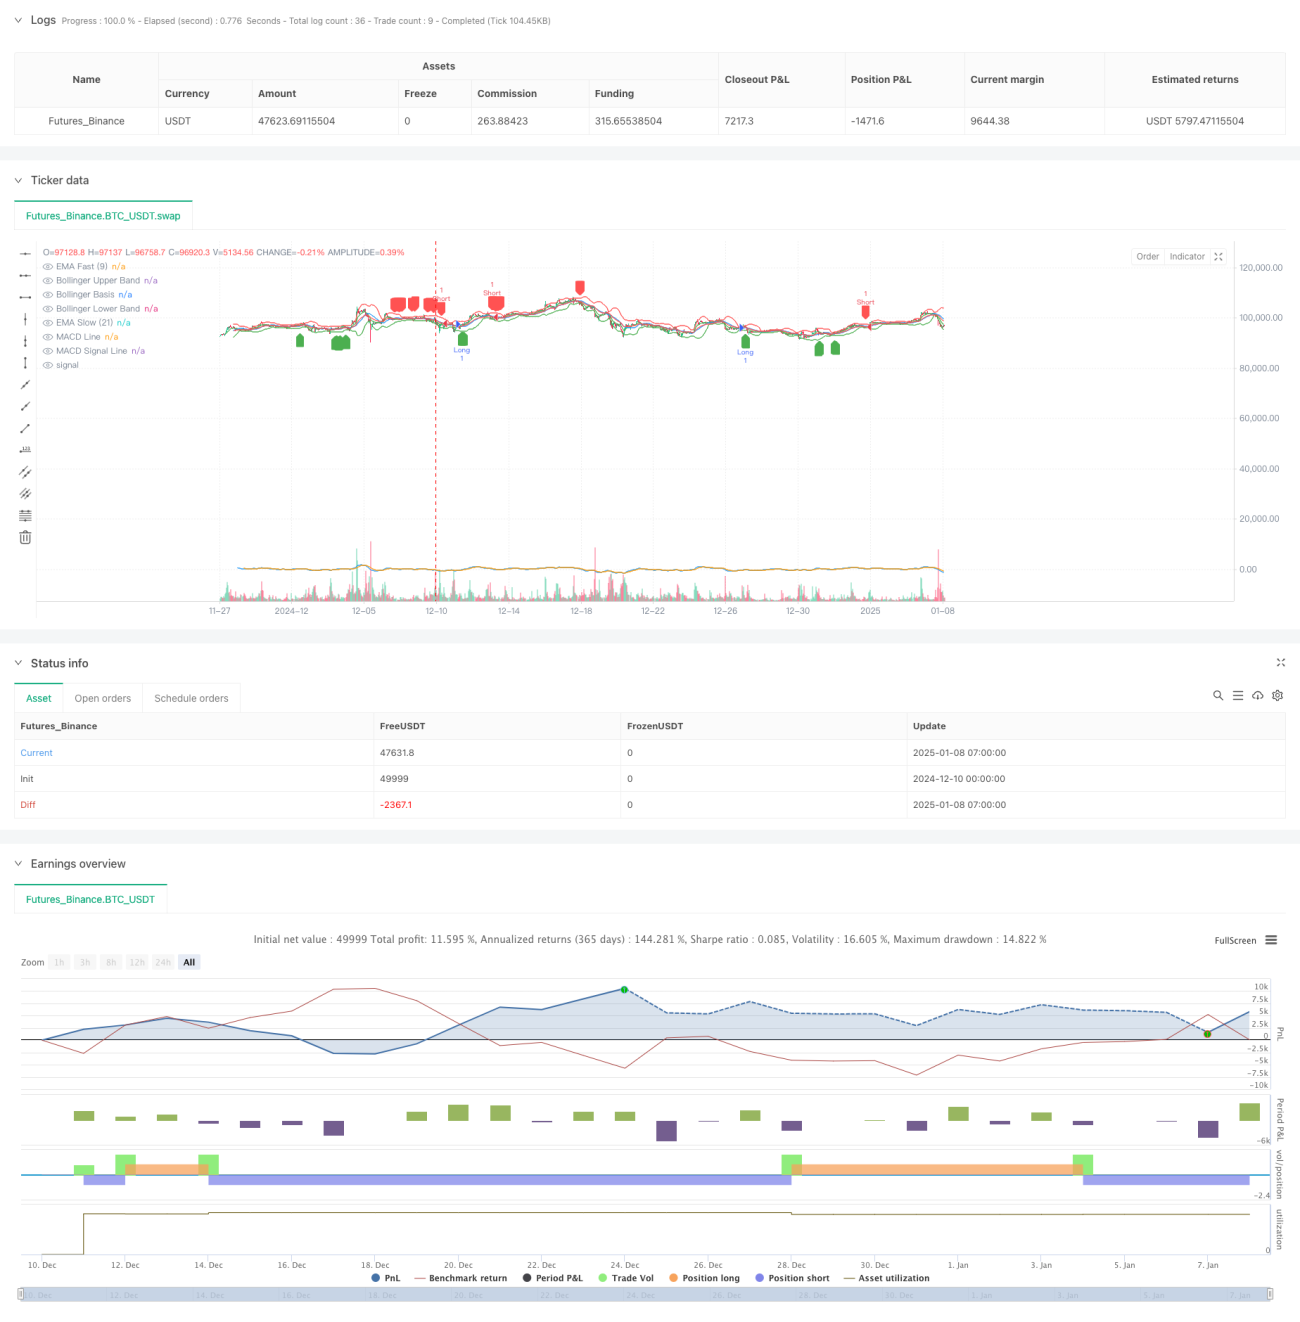
本戦略は多次元テクニカル分析取引システムであり、モメンタム指標(RSI、MACD)、トレンド指標(EMA)、ボラティリティ指標(ボリンジャーバンド、ATR)、価格構造指標(フィボナッチリトレースメント)を組み合わせ、複数のシグナルを協調させて市場機会を捉えます。戦略は15分足を基準とし、ATRによる動的ストップロス・利確を採用し、強力なリスク管理能力を持ちます。
戦略原理
戦略の核心ロジックは以下の次元から構成されます:
- トレンド確認:9/21周期EMAクロスでトレンド方向を判断
- モメンタム検証:RSIの売られ過ぎ・買われ過ぎ(55/45)およびMACDヒストグラムでモメンタムを検証
- ボラティリティ参照:ボリンジャーバンド(20周期、2標準偏差)で価格変動を測定
- サポート・レジスタンス:100周期の高値・安値から計算したフィボナッチ0.382/0.618/0.786水準
- リスク管理:14周期ATRの1.5倍ストップロス、3倍利確
複数の次元シグナルが協調して初めて取引を実行し、取引精度を高めます。
戦略の優位性
- 多次元シグナルの相互検証により、偽シグナルを大幅に低減
- 動的ATRストップロス・利確で様々な市場環境に対応
- 古典的テクニカル指標を組み合わせており、理解・保守が容易
- 精密なエントリータイミングで勝率向上
- リスクリワード比1:2でプロの取引基準に適合
- ボラティリティの高い市場環境に適する
戦略のリスク
- パラメータ最適化により過学習の可能性
- 複数シグナル条件により一部の相場を逃す可能性
- 固定倍率ストップロスが極端な相場で機能しない可能性
- 計算リソースを多く消費する
- 取引コストが戦略パフォーマンスに影響を与える可能性
戦略最適化の方向性
- 出来高要因を導入してシグナル強度を検証
- RSI閾値を動的に調整し市場に適合
- トレンド強度フィルターを追加
- ストップロス・利確倍率を最適化
- 時間フィルターを追加しレンジ相場を回避
- 機械学習による動的パラメータ最適化を検討
まとめ
本戦略は多次元テクニカル指標の協調により、安定した取引システムを構築しています。核心的な強みはシグナルの相互検証と動的リスク管理にありますが、パラメータ最適化や市場環境への適応性に注意が必要です。今後の最適化方向は、主に動的パラメータ調整とシグナル品質向上にあります。
Source
Pine
Strategy parameters
Related strategies
Comment
All comments (0)
No data
- 1