
1
Follow
1781
Followers
概要
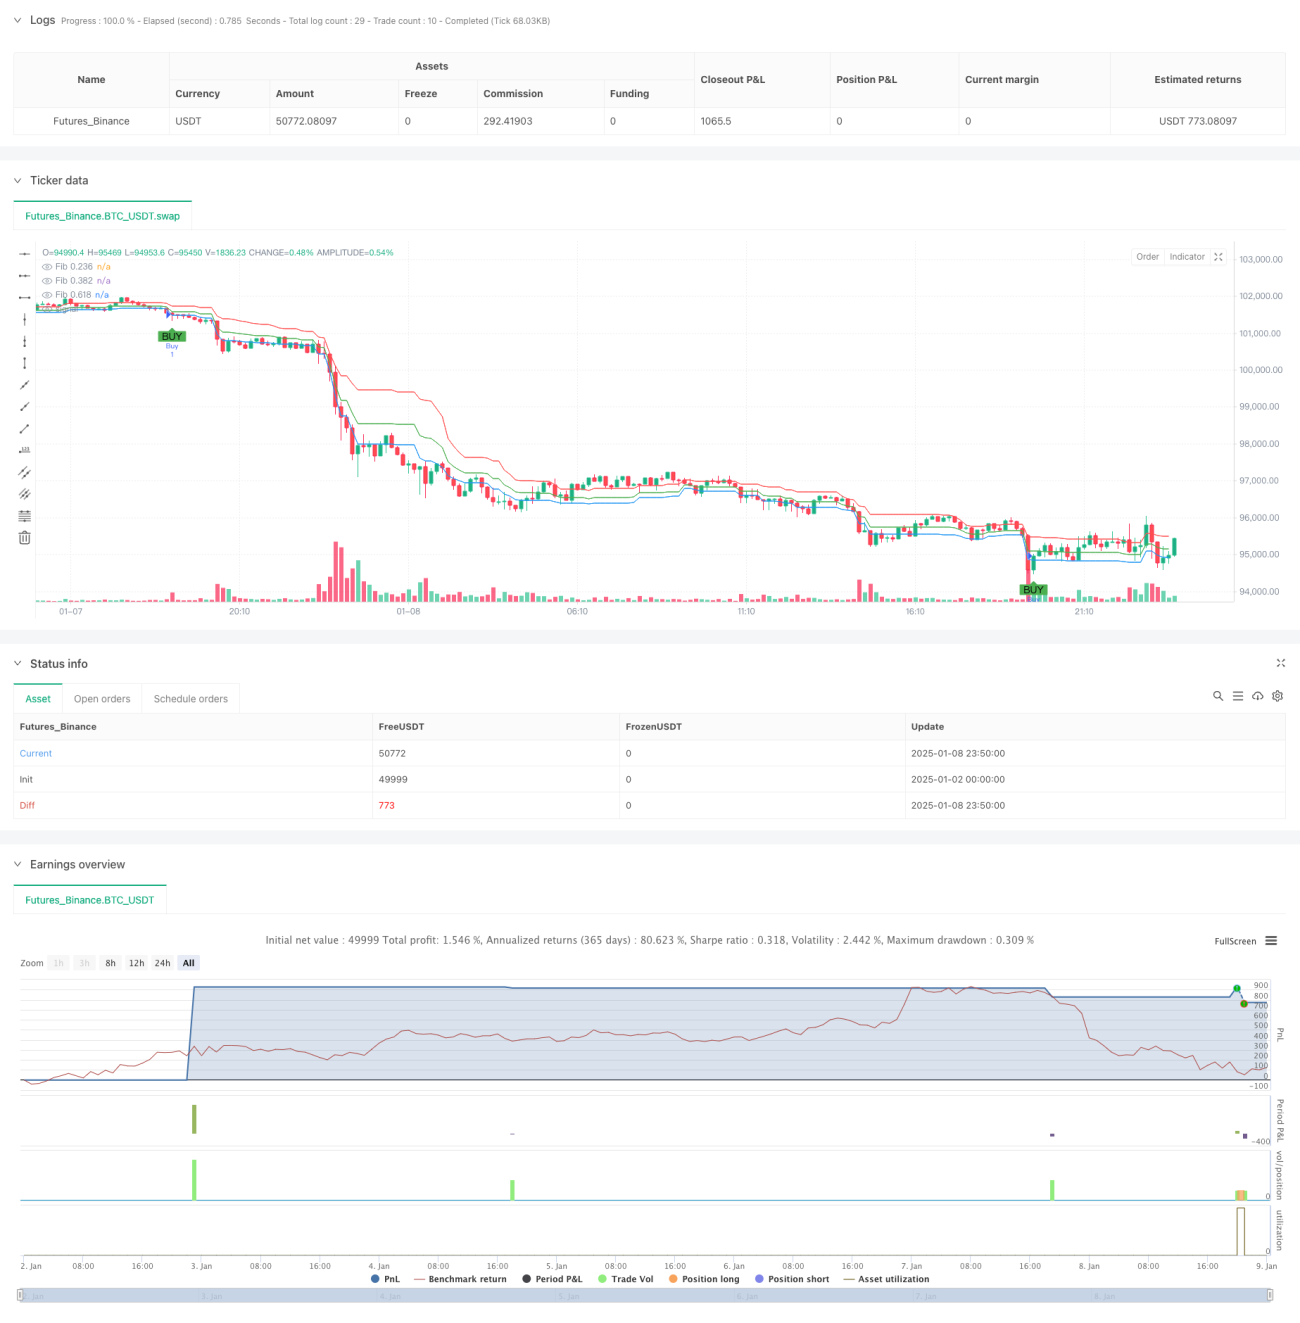
この戦略は、ボリンジャーバンドとフィボナッチリトレースメントレベルを組み合わせたデイトレードシステムです。ボリンジャーバンドインジケーターを使用して買われすぎと売られすぎの状態を識別し、フィボナッチリトレースメントレベルを使用して潜在的なサポートレベルとレジスタンスレベルを確認することで、市場変動における取引機会を捉えます。この戦略では、シグナル生成に 20 期間のボリンジャー バンドと 0.236、0.382、0.618 の 3 つの主要なフィボナッチ レベルを使用します。
戦略原則
戦略の中核となるロジックは、次の主要な要素に基づいています。
- ボリンジャーバンドの上限と下限(標準偏差は2)を使用して、価格の買われすぎと売られすぎの領域をマークします。
- 過去20期間の最高値と最低値を使用してフィボナッチリトレースメントレベルを計算します
- 価格がボリンジャーバンドの下限を上回り、フィボナッチ0.236または0.382のサポートレベルを上回ったときに、買いシグナルが生成されます。
- 価格がボリンジャーバンドの上限を上回り、フィボナッチ 0.618 抵抗レベルを下回ると、売りシグナルが生成されます。
- 固定ストップロスとテイクプロフィットポイントを使用してリスクを管理し、利益を確定します。
戦略的優位性
- トレンドとサポートとレジスタンスの二重確認メカニズムと組み合わせることで、取引シグナルの信頼性が向上します。
- ボリンジャーバンドは市場のボラティリティの変化に動的に適応できるため、戦略の適応性が非常に高くなります。
- フィボナッチレベルはエントリーとエグジットの明確な基準を提供します
- 固定ストップロスとテイクプロフィット設定により、リスクを厳密に管理できます。
- 戦略パラメータは、さまざまな市場状況に応じて柔軟に調整できます。
戦略リスク
- 不安定な市場では、誤ったブレイクアウトシグナルが頻繁に発生する可能性がある
- 固定ストップロスとテイクプロフィットの設定は、すべての市場状況に適しているわけではない。
- フィボナッチレベルの有効性は市場構造に大きく影響される
- トレンドの速い市場では、市場の動きを見逃してしまう可能性がある
- 市場の変化に適応するためにパラメータを継続的に監視し調整する必要がある
戦略最適化の方向性
- ブレイクアウトの有効性を確認するためのボリュームインジケーターの導入
- 市場のボラティリティに応じてストップロスとテイクプロフィットのレベルを動的に調整します
- 横ばい市場での取引を避けるためのトレンドフィルターを追加しました
- フィボナッチレベルの計算期間の最適化
- 流動性が低い期間の取引を避けるために時間フィルターを追加することを検討してください
要約する
これは、テクニカル分析の古典的なツールを組み合わせた完全な取引システムであり、ボリンジャー バンドとフィボナッチ リトレースメントの相乗効果を通じてトレーダーに体系的な取引フレームワークを提供します。一定の制限はあるものの、この戦略は適切なパラメータ最適化とリスク管理を通じて日中取引でうまく機能します。重要なのは、特定の取引商品と市場状況に基づいて、適切な調整と最適化を行うことです。
Source
Pine
Strategy parameters
Related strategies
Comment
All comments (0)
No data
- 1