ダイナミックニューラルネットワークRSIトレンドフォロー取引戦略

1
Follow
1781
Followers
概要
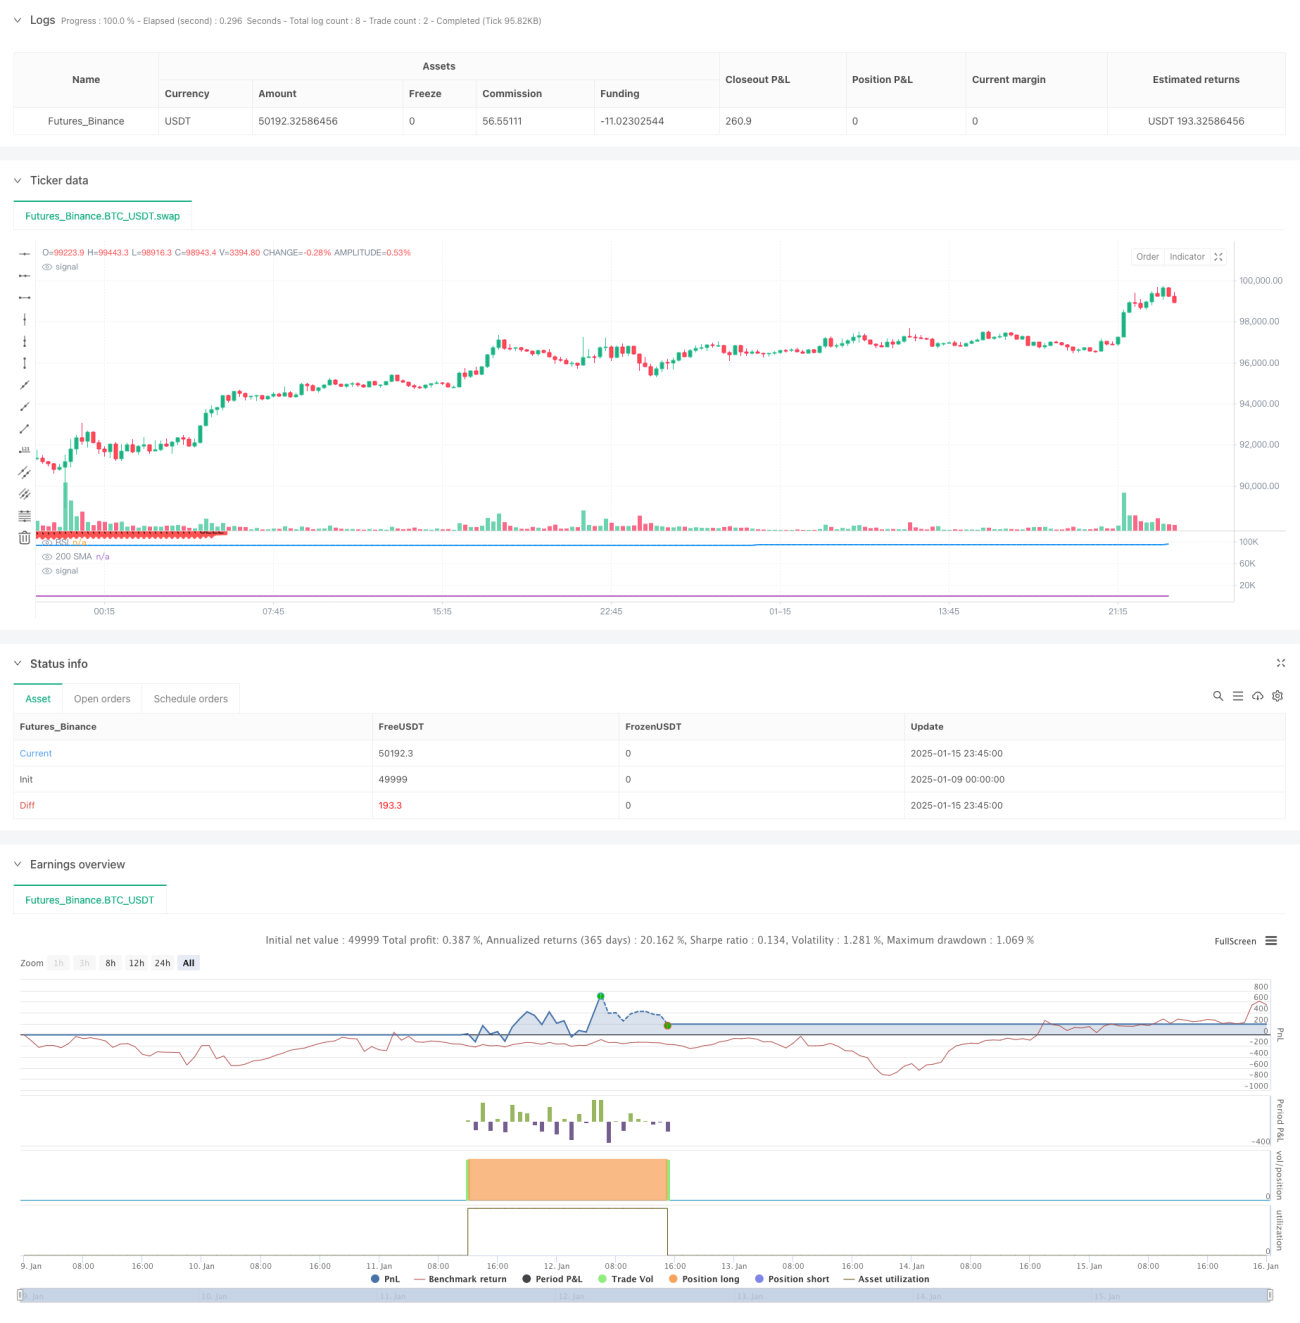
この戦略は、移動平均、RSI インジケーター、およびトレーリング ストップ ロスに基づいた定量的な取引システムです。テクニカル分析におけるトレンド追跡とモメンタム指標を組み合わせ、厳格なエントリー条件とエグジット条件を設定することでリスク管理された取引を実現します。この戦略の核となるロジックは、上昇トレンドで市場に参入するための売られ過ぎの機会を探し、トレーリングストップロスを使用して利益を保護することです。
戦略原則
この戦略では、200 日単純移動平均 (SMA) をトレンド判断の基準として使用し、相対力指数 (RSI) と組み合わせて取引シグナルを生成します。具体的には:
- 200日移動平均を使用して全体的な傾向を判断し、価格が移動平均を上回った場合にのみロングを検討します。
- RSI が事前に設定されたしきい値 (デフォルトは 40) を下回ると、売られすぎのシグナルと見なされます。
- 上記の両方の条件が満たされ、最後のポジションがクローズされてから待機期間(デフォルトは10日間)が経過すると、ロングシグナルがトリガーされます。
- ポジション保持中にトレーリングストップロスで利益を動的に保護する(デフォルト5%)
- 価格がトレーリングストップロス価格を下回るか、200日移動平均を下回ると、ポジションをクローズします。
戦略的優位性
- トレンドとモメンタムの二重フィルタリングを組み合わせて取引の精度を向上
- トラッキングストップロスメカニズムを使用すると、効果的に利益を確保できます。
- 頻繁な取引を避けるために取引間隔を設定する
- パラメータはさまざまな市場環境に適応できるよう高度に調整可能
- トランザクションロジックは明確で、理解しやすく、実行しやすい
- シンプルな計算と高い効率
戦略リスク
- 移動平均の遅れにより、エントリーとエグジットのシグナルが遅れる可能性がある
- RSI指標は不安定な市場では誤ったシグナルを生成する可能性がある
- 固定パーセンテージのトレーリングストップは、すべての市場状況に適しているわけではない。
- パラメータの最適化は過剰適合につながる可能性がある
- 不安定な市場では大きな下落に見舞われる可能性がある
戦略最適化の方向性
- ボラティリティ適応型トレーリングストップパーセンテージの導入
- 補助確認としてボリュームインジケーターを追加
- 感度を向上させるために単純移動平均の代わりに指数移動平均を使用する
- 市場センチメント指標を追加して取引機会を最適化します
- 動的パラメータ最適化メカニズムの開発
- 複数期間戦略確認メカニズムを追加
要約する
これは、完全な構造と明確なロジックを備えた定量的な取引戦略です。複数のテクニカル指標を組み合わせ、リスクをコントロールしながら安定したリターンを追求します。最適化の余地はあるものの、基本的なフレームワークは実用性と拡張性に優れています。この戦略は中長期投資家に適しており、さまざまな市場環境への適応性に優れています。
Source
Pine
Strategy parameters
Related strategies
Comment
All comments (0)
No data
- 1