
1
Follow
1781
Followers
概要
この戦略は、買われすぎと売られすぎの領域を特定して取引する相対力指数 (RSI) に基づいた動的な取引システムです。この戦略は特定の時間枠内で実行され、部分的な利益確定や動的ストップロスなどのリスク管理メカニズムを組み合わせます。このシステムは、RSI インジケーターの 70 レベルと 30 レベルのブレイクアウトを監視することで取引シグナルを決定し、柔軟なポジション管理方法を使用して取引結果を最適化します。
戦略原則
戦略のコアロジックは RSI インジケーターに基づいており、主に次の主要要素が含まれます。
- 14期間RSI指標を使用して市場の勢いを計算する
- RSIが70を突破するとショートシグナルが生成され、30を突破するとロングシグナルが生成されます。
- 8:00~11:00 GMT+2の間に取引を実行します
- 50%の部分利益と全利益の二重の利益停止メカニズムを採用
- 利益目標の一部に達したら、損益分岐点にストップロスポイントを調整する
- 固定ピップ(PIPS)を使用してストップロスと利益目標を設定します
戦略的優位性
- 取引時間枠の制限により誤ったシグナルが減り、取引の質が向上する
- 二重の利益獲得メカニズムにより、迅速な利益確保が保証され、大きな市場トレンドを見逃すことはありません。
- ダイナミックストップロスは既存の利益を保護し、リトレースメントのリスクを軽減します
- RSIインジケーターを使用すると、買われすぎと売られすぎの市場状況を特定するのに役立ちます。
- 戦略パラメータは、さまざまな市場状況に応じて柔軟に調整できます。
戦略リスク
- RSIインジケーターは横ばい市場では誤ったシグナルを生成する可能性がある
- 固定された時間枠では、他の期間の良い機会を逃す可能性がある
- 固定ポイントのストップロスは、すべての市場状況に適しているわけではない。
- 不安定な市場ではスリッページのリスクに直面する可能性があります
- 一部の利益確定メカニズムは、強い市場から時期尚早に撤退する可能性がある
戦略最適化の方向性
- 適応型RSIサイクルを導入し、指標を市場の状況に適応させやすくする
- ボラティリティに基づいてストップロスとテイクプロフィットのレベルを動的に調整する
- 横ばい市場での誤ったシグナルを減らすためにトレンドフィルターを追加しました
- 取引時間枠を最適化し、市場特性に応じて自動的に調整します
- 信号の信頼性を向上させるために音量確認メカニズムを追加
要約する
この戦略は、RSI インジケーターを通じて市場の買われすぎと売られすぎの機会を捉え、厳格なリスク管理と時間フィルタリングを組み合わせて完全な取引システムを形成します。いくつかの制限はあるものの、提案された最適化の方向性を通じて、戦略の安定性と収益性をさらに向上させることができます。戦略のモジュール設計により調整と最適化が容易になり、パーソナライズされた改善のための基本戦略として適しています。
Source
Pine
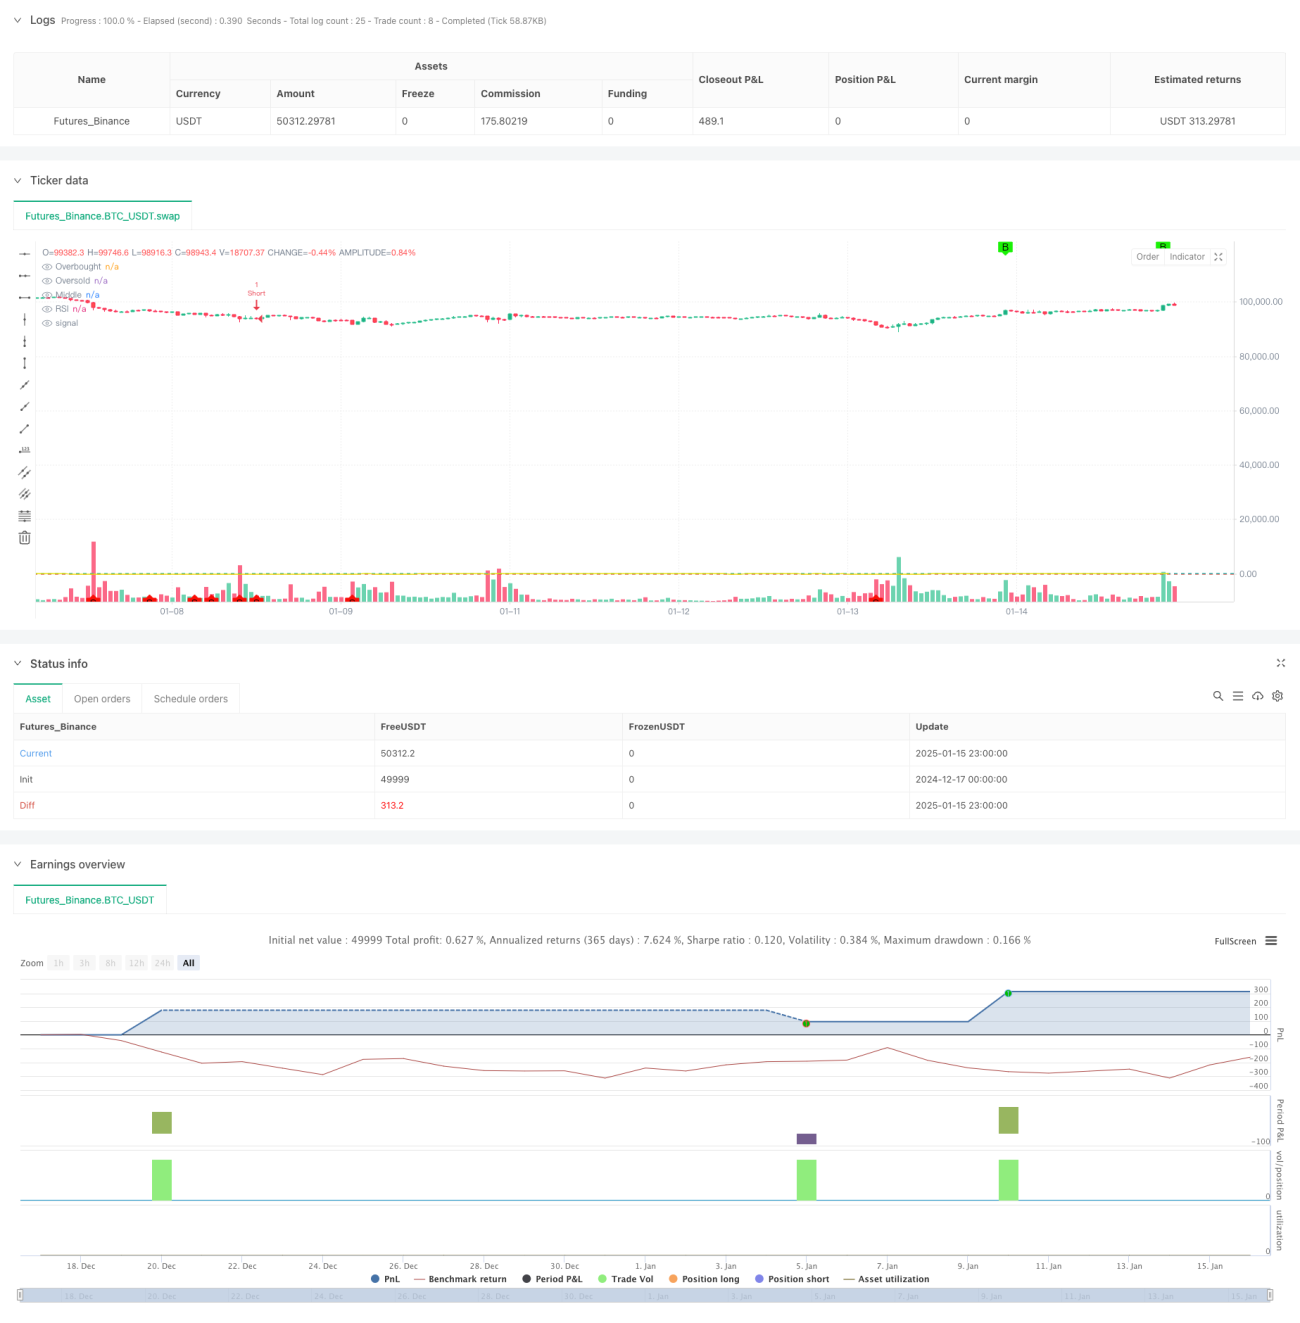
/*backtest
start: 2024-12-17 00:00:00
end: 2025-01-16 00:00:00
period: 1h
basePeriod: 1h
exchanges: [{"eid":"Futures_Binance","currency":"BTC_USDT","balance":49999}]
*/

//@version=5
strategy(title="RSI Overbought and Oversold Levels - Mikel Vaquero", shorttitle="RSI Levels", overlay=true)

// Configuración del RSIStrategy parameters
Related strategies
Comment
All comments (0)
No data
- 1