
1
Follow
1781
Followers
概要
この戦略は、ケルトナー チャネルと動的なサポート レベルおよびレジスタンス レベルに基づいた複合取引システムです。複数の期間を分析し、移動平均とボラティリティ指標を組み合わせることで、完全な取引意思決定フレームワークを形成します。この戦略の核心は、市場のトレンドとボラティリティを考慮しながら、価格が主要なテクニカルレベルを突破する瞬間を特定することで、高確率の取引機会を捉えることです。
戦略原則
この戦略では、分析に多層テクニカル指標システムを使用します。
- 21 期間のケニー チャネルを主なトレンド判定ツールとして使用し、チャネル幅は ATR 値によって決定されます。
- 左側の21本のローソク足と右側の8本のローソク足を使用して、主要なサポートレベルとレジスタンスレベルを計算します。
- トレンドフィルターとして高レベルの期間移動平均を導入
- 短期(5期間)と長期(30期間)の移動平均線を組み合わせてエントリータイミングを決定する
- ATRを使用してストップロスポジションを動的に調整する
戦略的優位性
- 多次元のテクニカル指標は相互検証し、誤ったシグナルを効果的に減らします。
- 動的なサポートとレジスタンスのレベルは、市場の変化に適応するためにリアルタイムで更新されます。
- 高レベルの期間分析を通じて二次市場の動向をフィルタリングする
- 異なる期間に応じてストップロスパラメータを柔軟に調整します
- パーセンテージポジション管理を使用してリスクを効果的に管理する
戦略リスク
- 不安定な市場では、頻繁に取引シグナルが生成される可能性がある
- 複数の指標を検証すると、取引機会を逃す可能性があります
- パラメータ最適化には過剰適合のリスクがある
- ボラティリティの高い環境ではストップが広すぎる可能性がある
- 市場が劇的に変化すると、サポートレベルとレジスタンスレベルが無効になる場合があります。
戦略最適化の方向性
- ブレークスルーの有効性を判断するのに役立つボリューム指標の導入
- 市場変動分析モジュールを追加し、パラメータを動的に調整する
- サポートレベルとレジスタンスレベルの計算方法を最適化して精度を向上
- トレンドの強さの判断を追加し、エントリー条件を改良
- ポジション管理システムを改善し、より洗練されたリスク管理を実現
要約する
これは、完全な構造と厳密なロジックを備えた定量的な取引戦略です。複数の層のテクニカル指標を協調して使用することで、取引シグナルの信頼性が保証され、効果的なリスク管理が実現します。この戦略は強力なスケーラビリティを備えており、継続的な最適化と改善を通じて、さまざまな市場環境で安定したパフォーマンスを維持することが期待されます。
Source
Pine
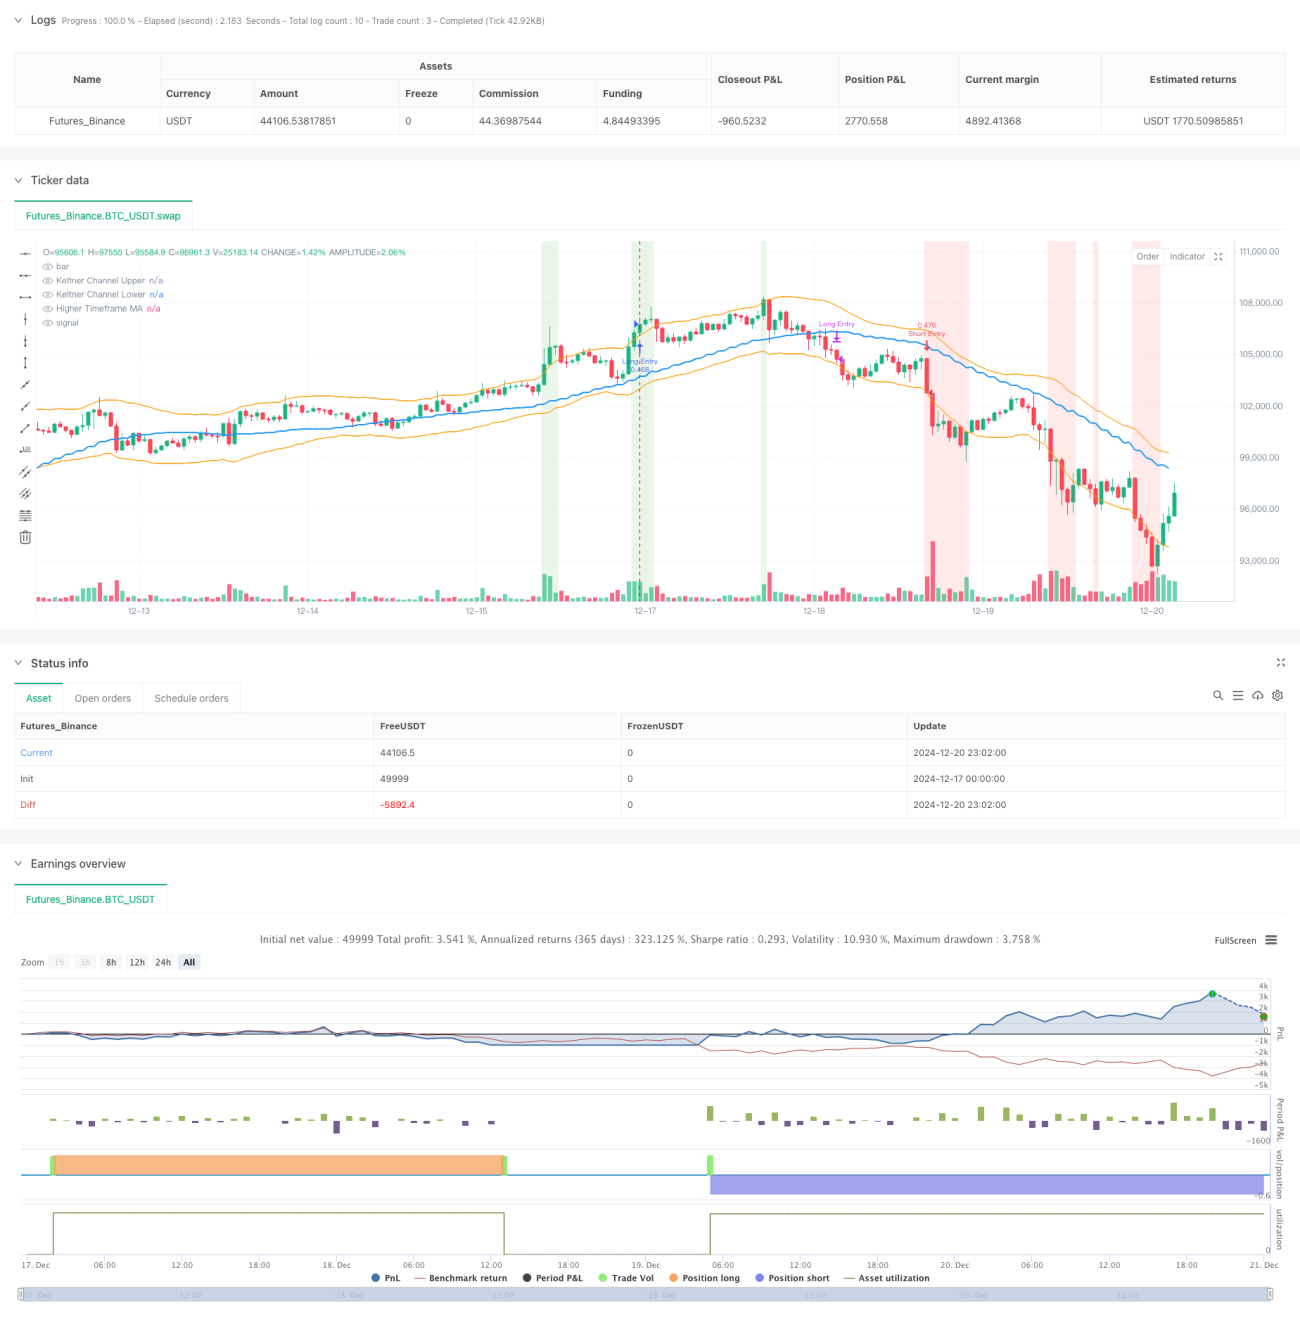
/*backtest
start: 2024-12-17 00:00:00
end: 2024-12-21 00:00:00
period: 1h
basePeriod: 1h
exchanges: [{"eid":"Futures_Binance","currency":"BTC_USDT","balance":49999}]
*/

// This Pine Script™ code is subject to the terms of the Mozilla Public License 2.0 at https://mozilla.org/MPL/2.0/
// © sathcm
//@version=5
strategy("KMS", overlay=true, initial_capital=100000, default_qty_type=strategy.percent_of_equity, default_qty_value=100, commission_type=strategy.commission.percent, commission_value=0.05, slippage=3)Strategy parameters
Related strategies
Comment
All comments (0)
No data
- 1