適応型マルチ戦略動的スイッチングシステム:トレンド追跡とレンジ振動を統合した定量的取引戦略

SMA BB RSI MA
作成日: 2025-01-17 16:02:23 最終変更日: 2025-01-17 16:02:23
コピー: 3 クリック数: 458
1
フォロー
1617
フォロワー

適応型マルチ戦略動的スイッチングシステム:トレンド追跡とレンジ振動を統合した定量的取引戦略

概要

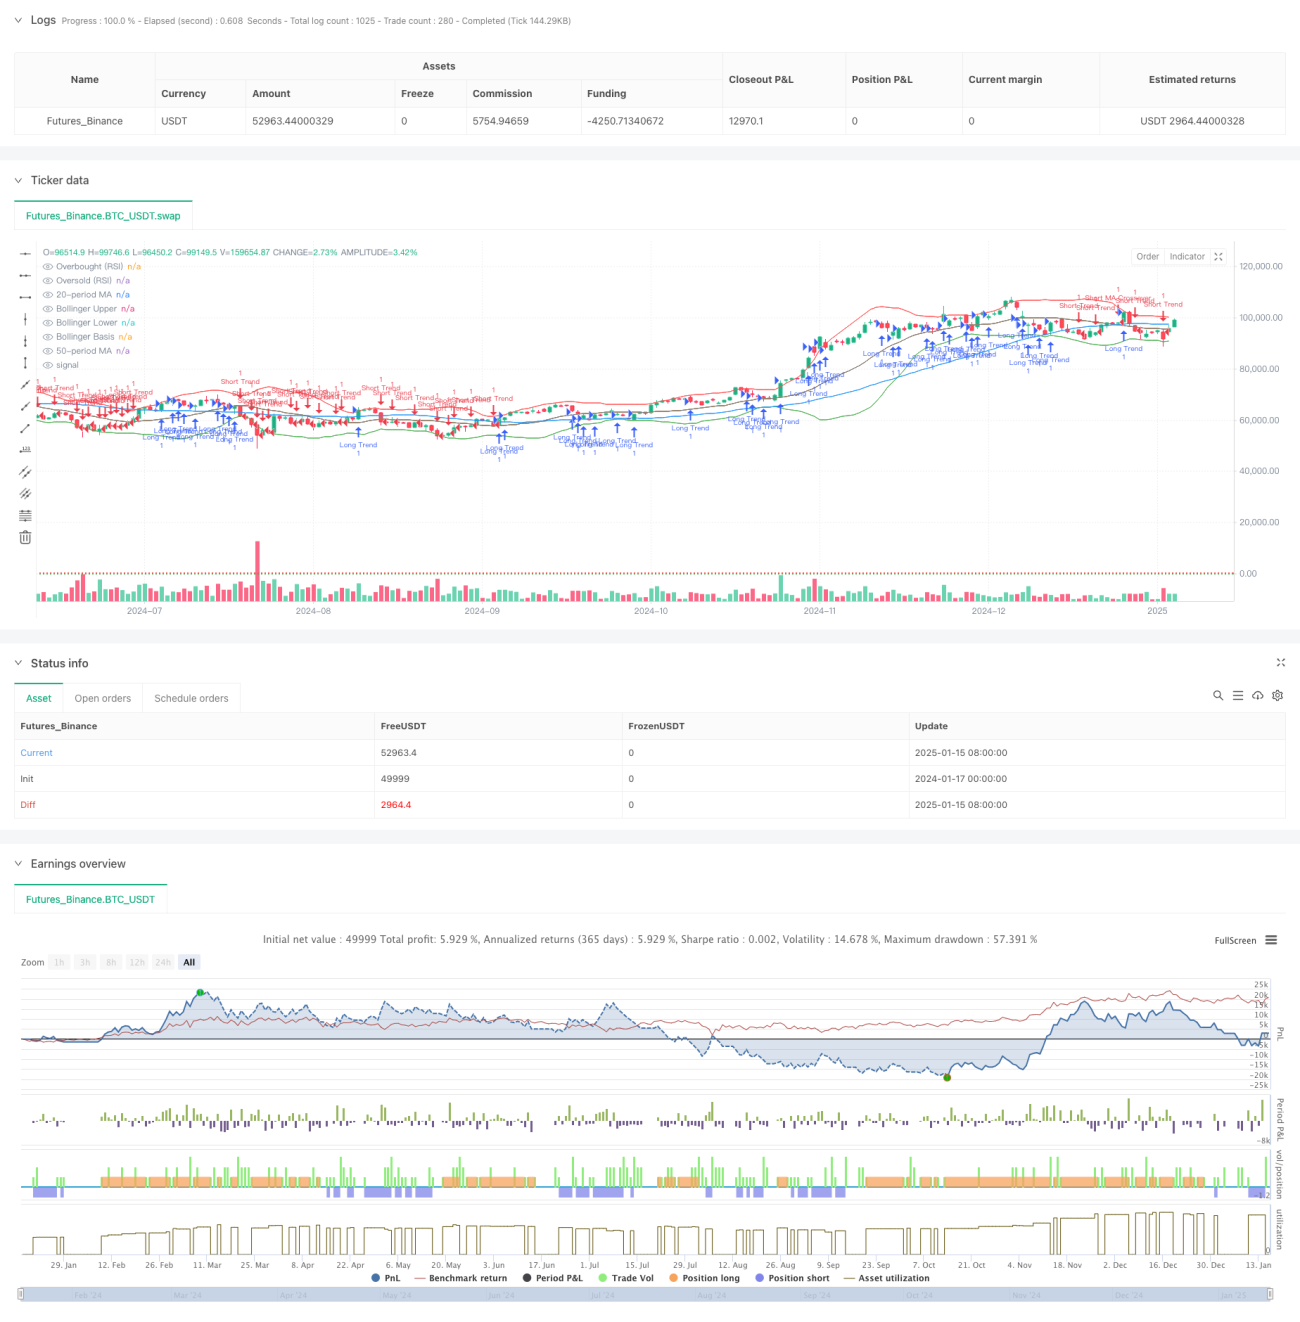
この戦略は、複数のテクニカル分析指標を統合し、市場の状況を動的に識別してさまざまな取引戦略を切り替える適応型取引システムです。このシステムは、移動平均(MA)、ボリンジャーバンド(BB)、相対力指数(RSI)の3つのテクニカル指標を主にベースとしており、市場の動向やレンジの変動に応じて最適な取引方法を自動的に選択します。この戦略では、異なる利益確定と損失ストップのパラメータを設定することにより、トレンド市場とレンジ市場に対して差別化されたリスク管理ソリューションを採用します。

戦略原則

この戦略では、50 期間および 20 期間の移動平均を使用して市場の傾向を判断し、ボリンジャー バンドと RSI インジケーターを組み合わせて買われすぎと売られすぎの領域を特定します。トレンド市場では、システムは主に価格と低速移動平均線の関係、および高速線と低速線のクロスオーバーに基づいて取引します。レンジ市場では、主にボリンジャーバンドの境界突破とRSIの買われすぎと売られすぎのシグナルに基づいて取引します。 。システムは市場環境に応じて自動的にテイクプロフィットレベルを調整します。トレンド市場では6%のテイクプロフィットが使用され、レンジ市場では4%のテイクプロフィットが使用されます。2%のストップロスは、リスク。

戦略的優位性

  1. 強力な市場適応性:さまざまな市場環境に応じて取引戦略を自動的に切り替え、システムの安定性を向上させる機能
  2. リスク管理の改善:トレンドとレンジの市場状況に応じて異なる利益確定比率が使用され、市場特性にさらに適合します。
  3. シグナルの多次元検証:複数のテクニカル指標のクロス検証を通じて取引シグナルの信頼性を向上
  4. 高度な自動化:完全に自動化された操作、手動介入の必要がなく、主観的な判断によるエラーを削減

戦略リスク

  1. パラメータ感度: 複数のテクニカル指標パラメータの選択は戦略のパフォーマンスに影響し、十分なパラメータ最適化が必要です。
  2. 市場切り替えの遅れ: 市場状況の判断に遅れが生じる可能性があり、それが戦略のパフォーマンスに影響します。
  3. 誤ったシグナルリスク: 不安定な市場では誤った取引シグナルが生成される可能性がある
  4. 取引コストの考慮: 戦略の切り替えを頻繁に行うと、取引コストが高くなる可能性がある

戦略最適化の方向性

  1. ボリュームインジケーターの導入: 既存のテクニカルインジケーターにボリューム分析を追加して、シグナルの信頼性を向上
  2. 市場状況判断の最適化:市場状況判断の精度向上のため、ATRやADXなどのトレンド強度指標の導入を検討
  3. 動的パラメータ調整: 市場のボラティリティに応じてストッププロフィットとストップロスのパラメータを自動的に調整し、戦略の適応性を向上させます。
  4. フィルタリングメカニズムの強化:誤ったシグナルを減らすために、より厳しい取引条件を設計する

要約する

この戦略は、複数の古典的なテクニカル指標を統合して、さまざまな市場環境に適応できる適応型取引システムを構築します。操作はシンプルにしながらも、マーケット状況の動的な把握や取引戦略の自動切り替えを実現しており、実用性に優れています。この戦略は、差別化された利益確定と損失停止の設定を通じて、リスクを管理しながら良好な収益性を維持します。将来的には、より多くのテクニカル指標を導入し、パラメータ調整メカニズムを最適化することで、戦略の安定性と信頼性をさらに向上させることができます。

ストラテジーソースコード
/*backtest
start: 2024-01-17 00:00:00
end: 2025-01-16 00:00:00
period: 1d
basePeriod: 1d
exchanges: [{"eid":"Futures_Binance","currency":"BTC_USDT","balance":49999}]
*/

//@version=6
strategy("Supply & Demand Test 1 - Enhanced", overlay=true)

// Inputs
ma_length = input.int(50, title="50-period Moving Average Length", minval=1)
ma_length_fast = input.int(20, title="20-period Moving Average Length", minval=1)
bb_length = input.int(20, title="Bollinger Bands Length", minval=1)
bb_std_dev = input.float(2.0, title="Bollinger Bands Std Dev", step=0.1)
rsi_length = input.int(14, title="RSI Length", minval=1)
stop_loss_percent = input.float(0.02, title="Stop Loss Percent", step=0.001, minval=0.001)
take_profit_trend = input.float(0.06, title="Take Profit Percent (Trend)", step=0.001, minval=0.001)
take_profit_range = input.float(0.04, title="Take Profit Percent (Range)", step=0.001, minval=0.001)

// Moving Averages
ma_slow = ta.sma(close, ma_length)
ma_fast = ta.sma(close, ma_length_fast)

// Bollinger Bands
bb_basis = ta.sma(close, bb_length)
bb_dev = ta.stdev(close, bb_length)
bb_upper = bb_basis + bb_std_dev * bb_dev
bb_lower = bb_basis - bb_std_dev * bb_dev

// RSI
rsi = ta.rsi(close, rsi_length)

// Market Conditions
is_trending_up = close > ma_slow
is_trending_down = close < ma_slow
is_range_bound = not (is_trending_up or is_trending_down)

// Entry Conditions
long_trend_entry = is_trending_up and close >= ma_slow * 1.02
short_trend_entry = is_trending_down and close <= ma_slow * 0.98
long_ma_crossover = ta.crossover(ma_fast, ma_slow)
short_ma_crossover = ta.crossunder(ma_fast, ma_slow)
long_range_entry = is_range_bound and close <= bb_lower * 0.97
short_range_entry = is_range_bound and close >= bb_upper * 1.03
long_rsi_entry = is_range_bound and rsi < 30
short_rsi_entry = is_range_bound and rsi > 70

// Entry and Exit Logic
if long_trend_entry
    strategy.entry("Long Trend", strategy.long)
    strategy.exit("Exit Long Trend", from_entry="Long Trend", stop=close * (1 - stop_loss_percent), limit=close * (1 + take_profit_trend))
    alert("Entered Long Trend", alert.freq_once_per_bar)

if short_trend_entry
    strategy.entry("Short Trend", strategy.short)
    strategy.exit("Exit Short Trend", from_entry="Short Trend", stop=close * (1 + stop_loss_percent), limit=close * (1 - take_profit_trend))
    alert("Entered Short Trend", alert.freq_once_per_bar)

if long_ma_crossover
    strategy.entry("Long MA Crossover", strategy.long)
    strategy.exit("Exit Long MA Crossover", from_entry="Long MA Crossover", stop=close * (1 - stop_loss_percent), limit=close * (1 + take_profit_trend))
    alert("Entered Long MA Crossover", alert.freq_once_per_bar)

if short_ma_crossover
    strategy.entry("Short MA Crossover", strategy.short)
    strategy.exit("Exit Short MA Crossover", from_entry="Short MA Crossover", stop=close * (1 + stop_loss_percent), limit=close * (1 - take_profit_trend))
    alert("Entered Short MA Crossover", alert.freq_once_per_bar)

if long_range_entry
    strategy.entry("Long Range", strategy.long)
    strategy.exit("Exit Long Range", from_entry="Long Range", stop=close * (1 - stop_loss_percent), limit=close * (1 + take_profit_range))
    alert("Entered Long Range", alert.freq_once_per_bar)

if short_range_entry
    strategy.entry("Short Range", strategy.short)
    strategy.exit("Exit Short Range", from_entry="Short Range", stop=close * (1 + stop_loss_percent), limit=close * (1 - take_profit_range))
    alert("Entered Short Range", alert.freq_once_per_bar)

if long_rsi_entry
    strategy.entry("Long RSI", strategy.long)
    strategy.exit("Exit Long RSI", from_entry="Long RSI", stop=close * (1 - stop_loss_percent), limit=close * (1 + take_profit_range))
    alert("Entered Long RSI", alert.freq_once_per_bar)

if short_rsi_entry
    strategy.entry("Short RSI", strategy.short)
    strategy.exit("Exit Short RSI", from_entry="Short RSI", stop=close * (1 + stop_loss_percent), limit=close * (1 - take_profit_range))
    alert("Entered Short RSI", alert.freq_once_per_bar)

// Plotting
plot(ma_slow, color=color.blue, title="50-period MA")
plot(ma_fast, color=color.orange, title="20-period MA")
plot(bb_upper, color=color.red, title="Bollinger Upper")
plot(bb_lower, color=color.green, title="Bollinger Lower")
plot(bb_basis, color=color.gray, title="Bollinger Basis")
hline(70, "Overbought (RSI)", color=color.red, linestyle=hline.style_dotted)
hline(30, "Oversold (RSI)", color=color.green, linestyle=hline.style_dotted)