多次元K近傍アルゴリズムとローソク足パターンのボリューム価格分析取引戦略

SMA KNN RSI VOL MA SD
作成日: 2025-01-17 16:10:07 最終変更日: 2025-01-17 16:10:07
コピー: 0 クリック数: 436
1
フォロー
1617
フォロワー

多次元K近傍アルゴリズムとローソク足パターンのボリューム価格分析取引戦略

概要

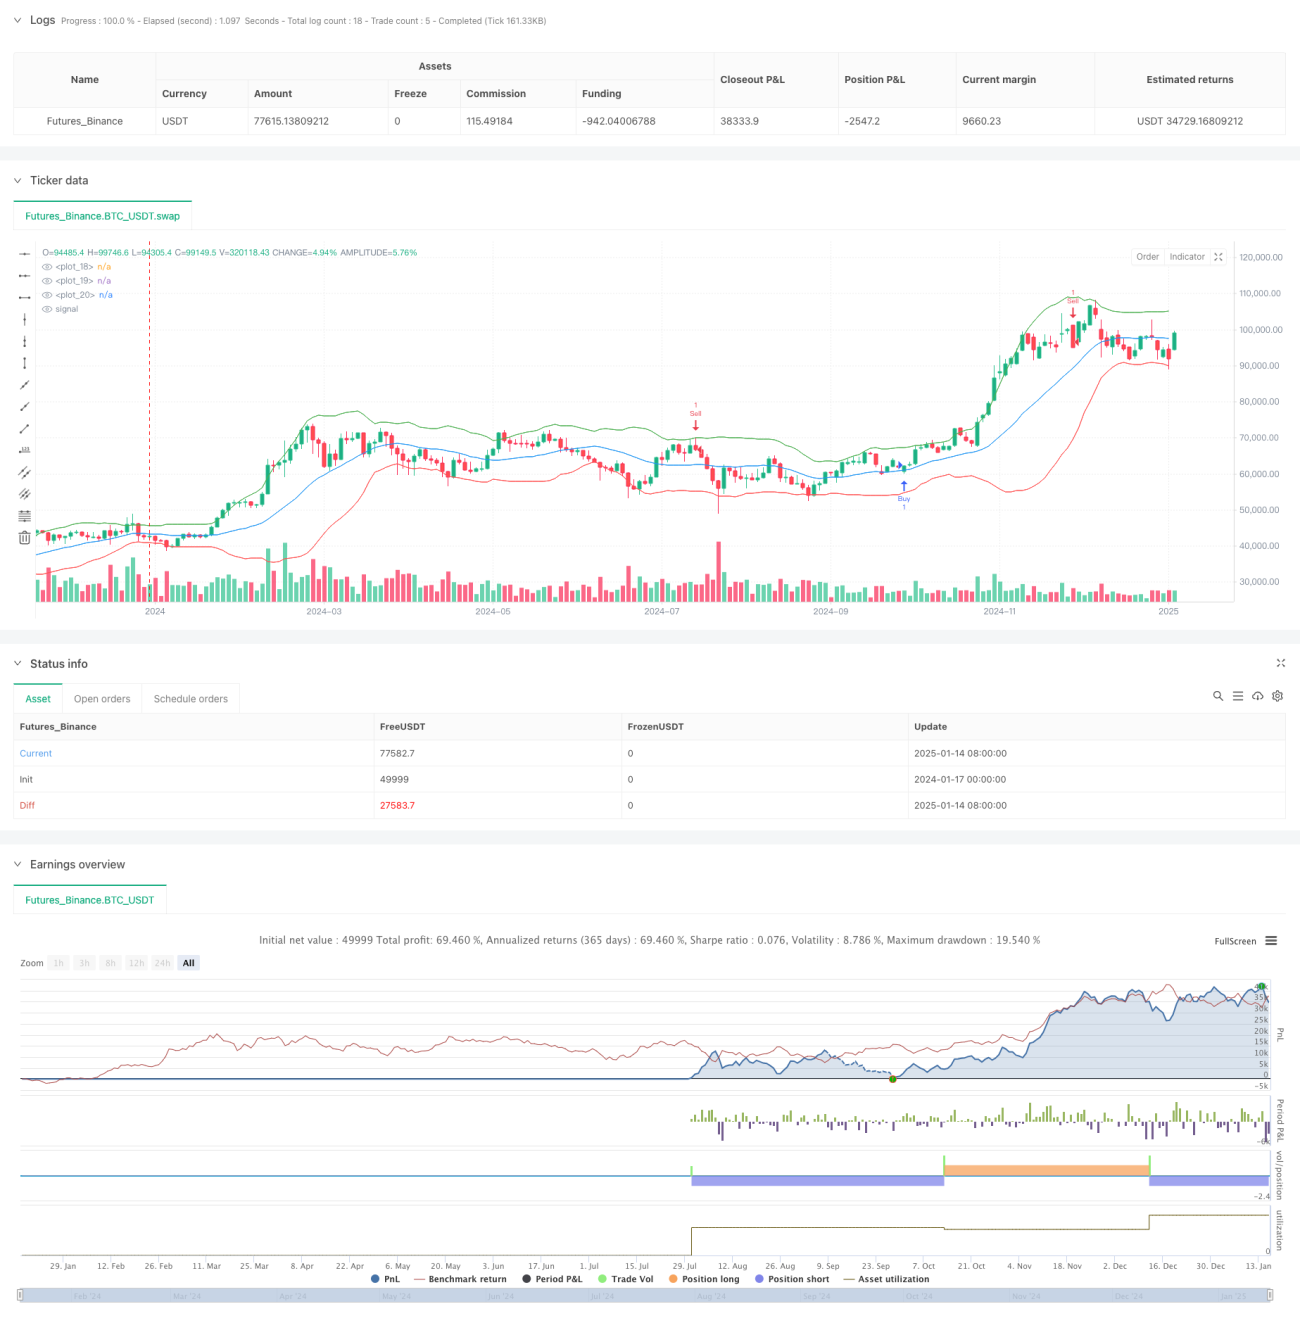
この戦略は、K 最近傍 (KNN) 機械学習アルゴリズム、ローソク足パターン認識、およびボリューム分析を組み合わせた包括的な取引システムです。この戦略は、移動平均チャネル、ボリュームしきい値検証、確率統計などの多次元分析方法を通じて市場の 3 次元分析フレームワークを形成し、潜在的な取引機会を捉えます。

戦略原則

戦略の中核となるロジックは、次の主要要素に基づいています。

  1. 移動平均(SMA)と標準偏差を使用して価格チャネルを構築し、買われすぎと売られすぎの領域を特定します。
  2. ハンマー、シューティングスター、エングルフィングなど、プログラムで定義された条件を通じて 9 つの古典的なローソク足パターンを識別します。
  3. KNNアルゴリズムを導入して過去の価格動向を学習し、将来の価格動向を予測する
  4. 取引量をシグナル確認指標として使用するには、シグナルがトリガーされたときに取引量が設定されたしきい値よりも高くなければなりません。
  5. 上昇と下降の確率分布を計算し、それを信号フィルタリング条件の1つとして使用する

戦略的優位性

  1. マルチレベル信号確認メカニズムにより、取引の信頼性が大幅に向上します。
  2. KNNアルゴリズムの導入により、従来のテクニカル分析に機械学習の視点がもたらされる。
  3. ボリューム検証メカニズムは、誤った突破を効果的に回避します。
  4. サポートラインとレジスタンスラインの動的な描画は重要な価格レベルを特定するのに役立ちます
  5. 包括的なアラートシステムにより、重要な取引機会を逃すことがなくなります。
  6. 戦略パラメータは高度に調整可能であり、さまざまな市場環境に適応できます。

戦略リスク

  1. KNNアルゴリズムは不安定な市場では遅れをとる可能性がある
  2. シグナルフィルタリング条件が多すぎると、取引機会を逃す可能性があります。
  3. 固定ボリュームしきい値は、異なる期間で動的に調整する必要がある場合があります。
  4. 横ばい局面では誤ったシグナルが多すぎる可能性がある 推奨:
  • アルゴリズムパラメータを動的に調整する
  • 市場環境識別メカニズムの導入
  • 最大損失限度額を設定する
  • 倉庫管理システムの確立

戦略最適化の方向性

  1. 適応型パラメータ調整メカニズムを導入し、市場の状況に応じて戦略パラメータを自動的に調整できるようにします。
  2. ディープラーニングアルゴリズムを統合して予測精度を向上
  3. 市場構造指標の追加
  4. 取引量閾値の動的計算方法の最適化
  5. より完全なリスク管理システムを確立する

要約する

この戦略は、従来のテクニカル分析と最新の機械学習手法を組み合わせることで、堅牢な取引システムを構築します。この戦略の多次元分析フレームワークと厳格なシグナル確認メカニズムは、取引決定のための信頼できる基盤を提供します。この戦略は、継続的な最適化とリスク管理を通じて、さまざまな市場環境において安定したパフォーマンスを維持することが期待されます。

ストラテジーソースコード
/*backtest
start: 2024-01-17 00:00:00
end: 2025-01-16 00:00:00
period: 2d
basePeriod: 2d
exchanges: [{"eid":"Futures_Binance","currency":"BTC_USDT","balance":49999}]
*/

//@version=6
strategy("Candle Pattern Analyzer with Volume", overlay=true)

// Input parameters
length = input.int(20, "Channel Length", minval=1)
mult = input.float(2.0, "Volatility Multiplier", minval=0.1)
candleLength = input.int(5, "Candle Length", minval=1)
k = input.int(5, "KNN Neighbors", minval=1)
volumeThreshold = input.int(100000, "Volume Threshold", minval=1)

// Calculate channel
basis = ta.sma(close, length)
dev = mult * ta.stdev(close, length)
upper = basis + dev
lower = basis - dev

// Plot channel
plot(basis, color=color.blue)
plot(upper, color=color.green)
plot(lower, color=color.red)

// Identify candle patterns
isBullish = close > open
isBearish = close < open

// Pre-calculate SMAs
smaLow = ta.sma(low, candleLength)
smaHigh = ta.sma(high, candleLength)
smaClose = ta.sma(close, candleLength)

// Hammer pattern
isHammer = isBullish and 
           low < smaLow and 
           close > smaClose and 
           (close - low) / (high - low) > 0.6 and
           low < low[1]

// Shooting Star pattern
isShootingStar = isBearish and 
                 high > smaHigh and 
                 close < smaClose and 
                 (high - close) / (high - low) > 0.6 and
                 high > high[1]

// Inverse Hammer pattern
isInverseHammer = isBullish and 
                   high > smaHigh and 
                   close < smaClose and 
                   (high - close) / (high - low) > 0.6 and
                   high > high[1]

// Bullish Engulfing pattern
isBullishEngulfing = isBullish and 
                      close > high[1] and 
                      open < low[1]

// Bearish Engulfing pattern
isBearishEngulfing = isBearish and 
                      close < low[1] and 
                      open > high[1]

// Morning Star pattern
isMorningStar = isBullish and close[2] < open[2] and close[1] < open[1] and  close > open[1]

// Evening Star pattern
isEveningStar = isBearish and  close[2] > open[2] and  close[1] > open[1] and  close < open[1]

// Three Black Crows pattern
isThreeBlackCrows = isBearish and 
                     close < close[1] and 
                     close[1] < close[2] and 
                     close[2] < close[3]

// Three White Soldiers pattern
isThreeWhiteSoldiers = isBullish and close > close[1] and  close[1] > close[2] and  close[2] > close[3]

// Compare previous candles
prevCandleUp = close[1] > open[1]
prevCandleDown = close[1] < open[1]

// Calculate probability
probUp = ta.sma(close > open ? 1 : 0, candleLength) / candleLength
probDown = ta.sma(close < open ? 1 : 0, candleLength) / candleLength

// Generate signals
buySignal = isHammer and prevCandleDown and probUp > probDown and volume > volumeThreshold
sellSignal = isShootingStar and prevCandleUp and probDown > probUp and volume > volumeThreshold

// Highlight patterns
color candleColor = na
if (isHammer)
    candleColor := color.green
    label.new(bar_index, high, "Hammer", color=color.green, style=label.style_label_up)

else if (isShootingStar)
    candleColor := color.red
    label.new(bar_index, low, "Shooting Star", color=color.red, style=label.style_label_down)
else if (isInverseHammer)
    candleColor := color.blue
    label.new(bar_index, high, "Inverse Hammer", color=color.blue, style=label.style_label_up)
else if (isBullishEngulfing)
    candleColor := color.yellow
    label.new(bar_index, high, "Bullish Engulfing", color=color.yellow, style=label.style_label_up)
else if (isBearishEngulfing)
    candleColor := color.purple
    label.new(bar_index, low, "Bearish Engulfing", color=color.purple, style=label.style_label_down)

else if (isMorningStar)
    candleColor := color.orange
    label.new(bar_index, high, "Morning Star", color=color.orange, style=label.style_label_up)

else if (isEveningStar)
    candleColor := color.new(color.red, 80)
    label.new(bar_index, low, "Evening Star", color=color.new(color.red, 80), style=label.style_label_down)

else if (isThreeBlackCrows)
    candleColor := color.black
    label.new(bar_index, low, "Three Black Crows", color=color.black, style=label.style_label_down)

else if (isThreeWhiteSoldiers)
    candleColor := color.white
    label.new(bar_index, high, "Three White Soldiers", color=color.white, style=label.style_label_up)


// Plot candles
barcolor(candleColor)

// KNN algorithm
var float[] knnData = array.new_float(k, na)
var float[] knnLabels = array.new_float(k, na) // Create an array to store KNN labels
array.set(knnLabels, 0, 1.0) // Label for "up" movement

// Shift KNN dataset to make room for new data point
for i = 1 to k-1
    array.set(knnData, i, array.get(knnData, i-1))
    array.set(knnLabels, i, array.get(knnLabels, i-1))

// Predict next movement using KNN algorithm
float prediction = 0.0
for i = 0 to k-1
    float distance = math.abs(close - array.get(knnData, i))
    prediction += array.get(knnLabels, i) / distance

prediction /= k

// Plot prediction
// line.new(bar_index, close, bar_index + 1, prediction, color=color.purple)

// Plot resistance and support lines
float resistance = ta.sma(high, length)
float support = ta.sma(low, length)
// line.new(bar_index, resistance, bar_index + 1, resistance, color=color.green, style=line.style_dashed)
// line.new(bar_index, support, bar_index + 1, support, color=color.red, style=line.style_dashed)

// Plot buy and sell signals with prices
if (buySignal)
    // label.new(bar_index, low, "Buy at " + str.tostring(low), color=color.green, style=label.style_label_up)
    strategy.entry("Buy", strategy.long, comment="Buy at " + str.tostring(low))
if (sellSignal)
    // label.new(bar_index, high, "Sell at " + str.tostring(high), color=color.red, style=label.style_label_down)
    strategy.entry("Sell", strategy.short, comment="Sell at " + str.tostring(high))

// Create alerts
alertcondition(buySignal, title="Buy Signal", message="Buy signal generated!")
alertcondition(sellSignal, title="Sell Signal", message="Sell signal generated!")