ピラミッドポジション管理システムと組み合わせたデュアル期間RSIトレンドモメンタム強度戦略

1
Follow
1781
Followers
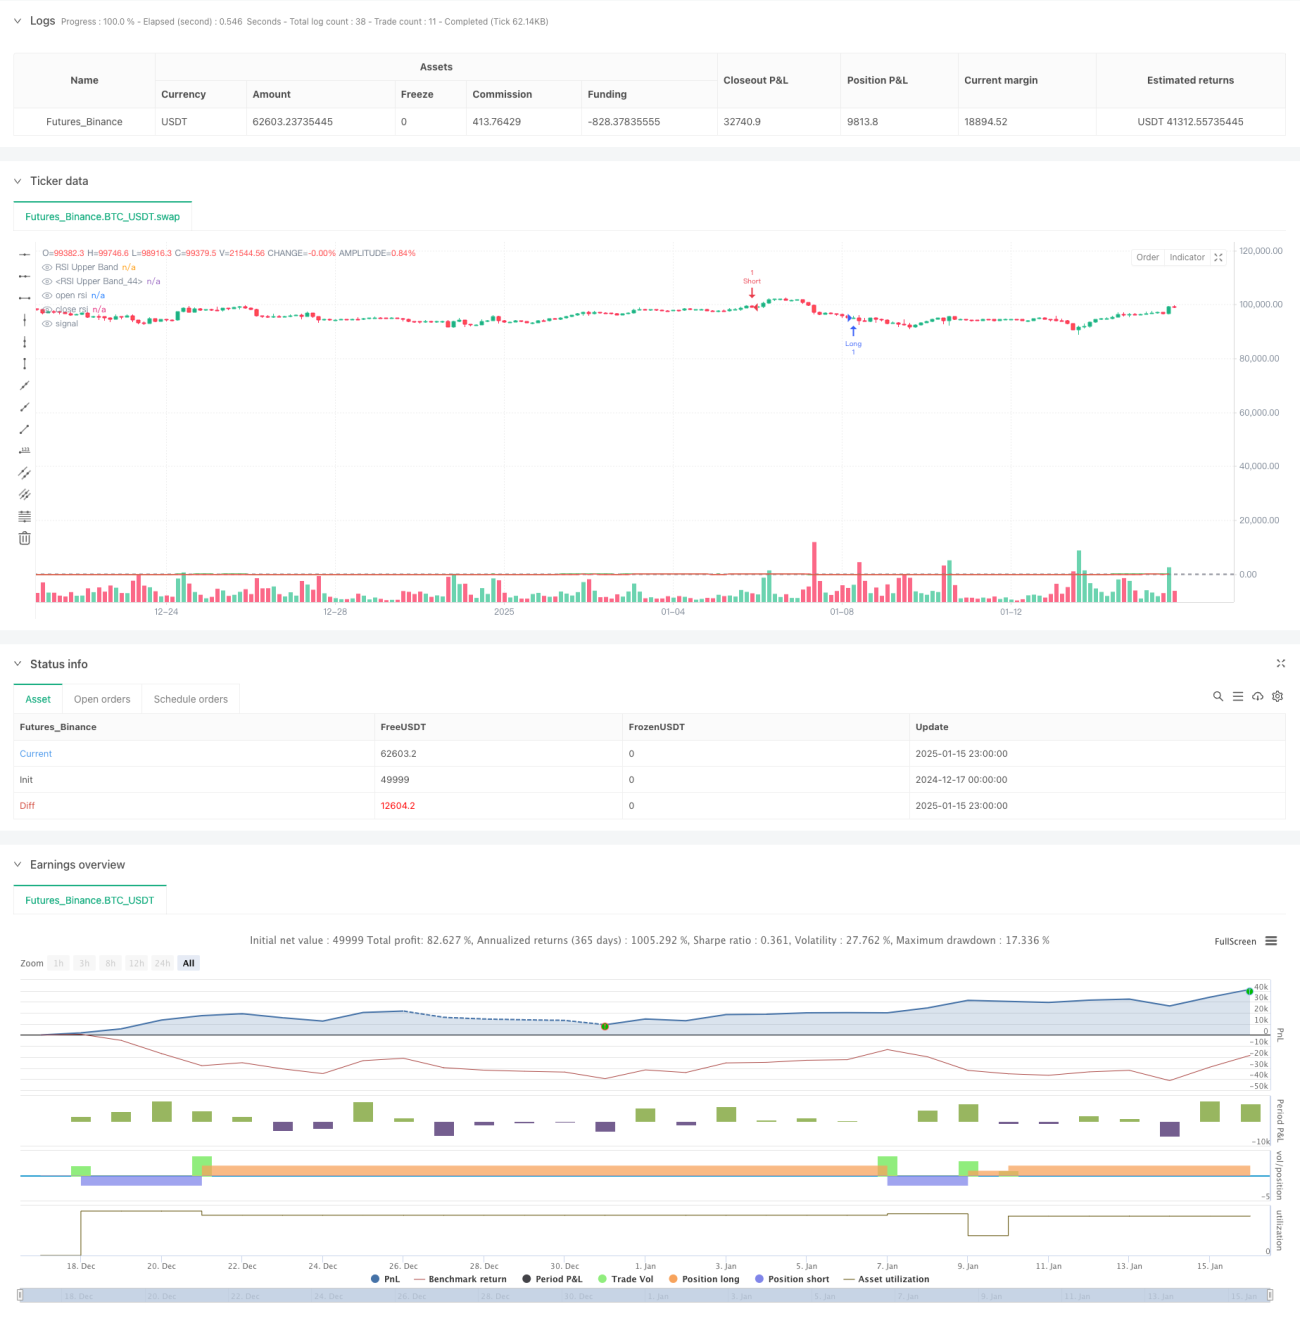
概要
この戦略は、ピラミッド型ポジション管理と組み合わせた、2 期間 RSI (相対力指数) に基づくトレンド追従型取引システムです。この戦略では、2 つの異なる期間 (14 と 30) の RSI インジケーターを比較し、トレンドの開始時に介入し、トレンドが継続している場合は指値注文を通じてポジションを増やして、トレンドの把握を最大化します。このシステムは、ポジション管理や動的な清算条件を含む完全なリスク管理メカニズムを備えて設計されています。
戦略原則
この戦略では、デュアル期間 RSI クロスオーバー信号を取引トリガー条件として使用し、それをピラミッド型の位置管理と組み合わせます。具体的には:
- エントリーシグナル: 14期間RSIを使用して、売られすぎ(30)と買われすぎ(70)のレベルを突破し、ポジションを開くシグナルとして使用します。
- ポジション増加管理:ポジションを開いた後、価格偏差1.5%の指値注文を設定することで、2回目のポジション増加を実現できます。
- 終値シグナル: 30期間のRSIを終値指標として使用し、RSIが買われすぎ領域から下がったり、売られすぎ領域から反発したりしたときに終値をトリガーします。
- ポジション制御:システムは最大2つのポジション(ピラミッド=2)を許可し、毎回開くポジションの数は個別に設定できます。
戦略的優位性
- 強力なトレンド把握能力:デュアル期間 RSI との連携により、中長期のトレンドをより適切に識別して追跡できます。
- リスクとリターンの比率を最適化する:トレンドが確立された後にポジションを追加することで利益を増幅するピラミッド型のポジション追加戦略を採用する
- 柔軟なポジション管理:市場の状況や資本量に応じて、オープンポジションと増加ポジションの数を調整できます。
- ダイナミックストップロス設計: 早期の終了を避けるために、長期RSIをポジションクローズ指標として使用します。
- 強力なパラメータ調整機能:主要なパラメータは、さまざまな市場特性に応じて最適化および調整できます。
戦略リスク
- 不安定な市場リスク: レンジ相場での頻繁な参入と撤退は損失につながる可能性があります
- スリッページリスク: ポジションを増やす注文は指値注文で実行されるため、不安定な市場ではポジションを増やす最適なタイミングを逃してしまう可能性があります。
- ファンド管理リスク: ポジションを倍増すると、より大きなドローダウンが発生する可能性があります
- トレンド反転リスク: RSI インジケーターには一定の遅れがあり、トレンドが反転したときに損失をストップできない可能性があります。
- パラメータ最適化リスク: 過度に最適化すると、実際の取引で戦略のパフォーマンスが低下する可能性があります。
戦略最適化の方向性
- トレンドフィルターの導入: 移動平均やADXなどのトレンドインジケーターを追加して、エントリーシグナルの信頼性を向上させることができます。
- ポジション管理の最適化: ボラティリティに応じてオープンポジションの数を調整する動的なポジション管理システムを設計できます。
- ストップロスメカニズムを改善する:トレーリングストップロスまたはATRベースのストップロスソリューションの追加を検討する
- 市場環境フィルタリングの強化:ボラティリティ指標を導入し、さまざまな市場環境で戦略パラメータを調整する
- ポジション追加ロジックの改善:ポジション追加価格の偏差はボラティリティに基づいて動的に調整可能
要約する
この戦略は、デュアル期間 RSI とピラミッド スタイルのポジション追加を組み合わせることで、トレンドを適切に把握します。この戦略は、エントリー、ポジションの増加、ストップロス、ポジション管理などの主要要素を含む完全な取引システムを設計します。パラメータの最適化とリスク管理の改善により、実際の取引において安定したパフォーマンスを実現することが期待されます。トレーダーは、実際の取引で使用する前に、特定の市場特性に応じてパラメータを十分にテストし、調整することをお勧めします。
Source
Pine
/*backtest
start: 2024-12-17 00:00:00
end: 2025-01-16 00:00:00
period: 3h
basePeriod: 3h
exchanges: [{"eid":"Futures_Binance","currency":"BTC_USDT","balance":49999}]
*/

//@version=5
strategy("RSI Top Strategy", overlay=true, pyramiding=2)

qty1 = input( 1 , "Qty first entry", group="Strategy settings")Strategy parameters
Related strategies
Comment
All comments (0)
No data
- 1