複数のテクニカル指標クロスオーバーモメンタムトレンドフォロー戦略

1
Follow
1781
Followers
概要
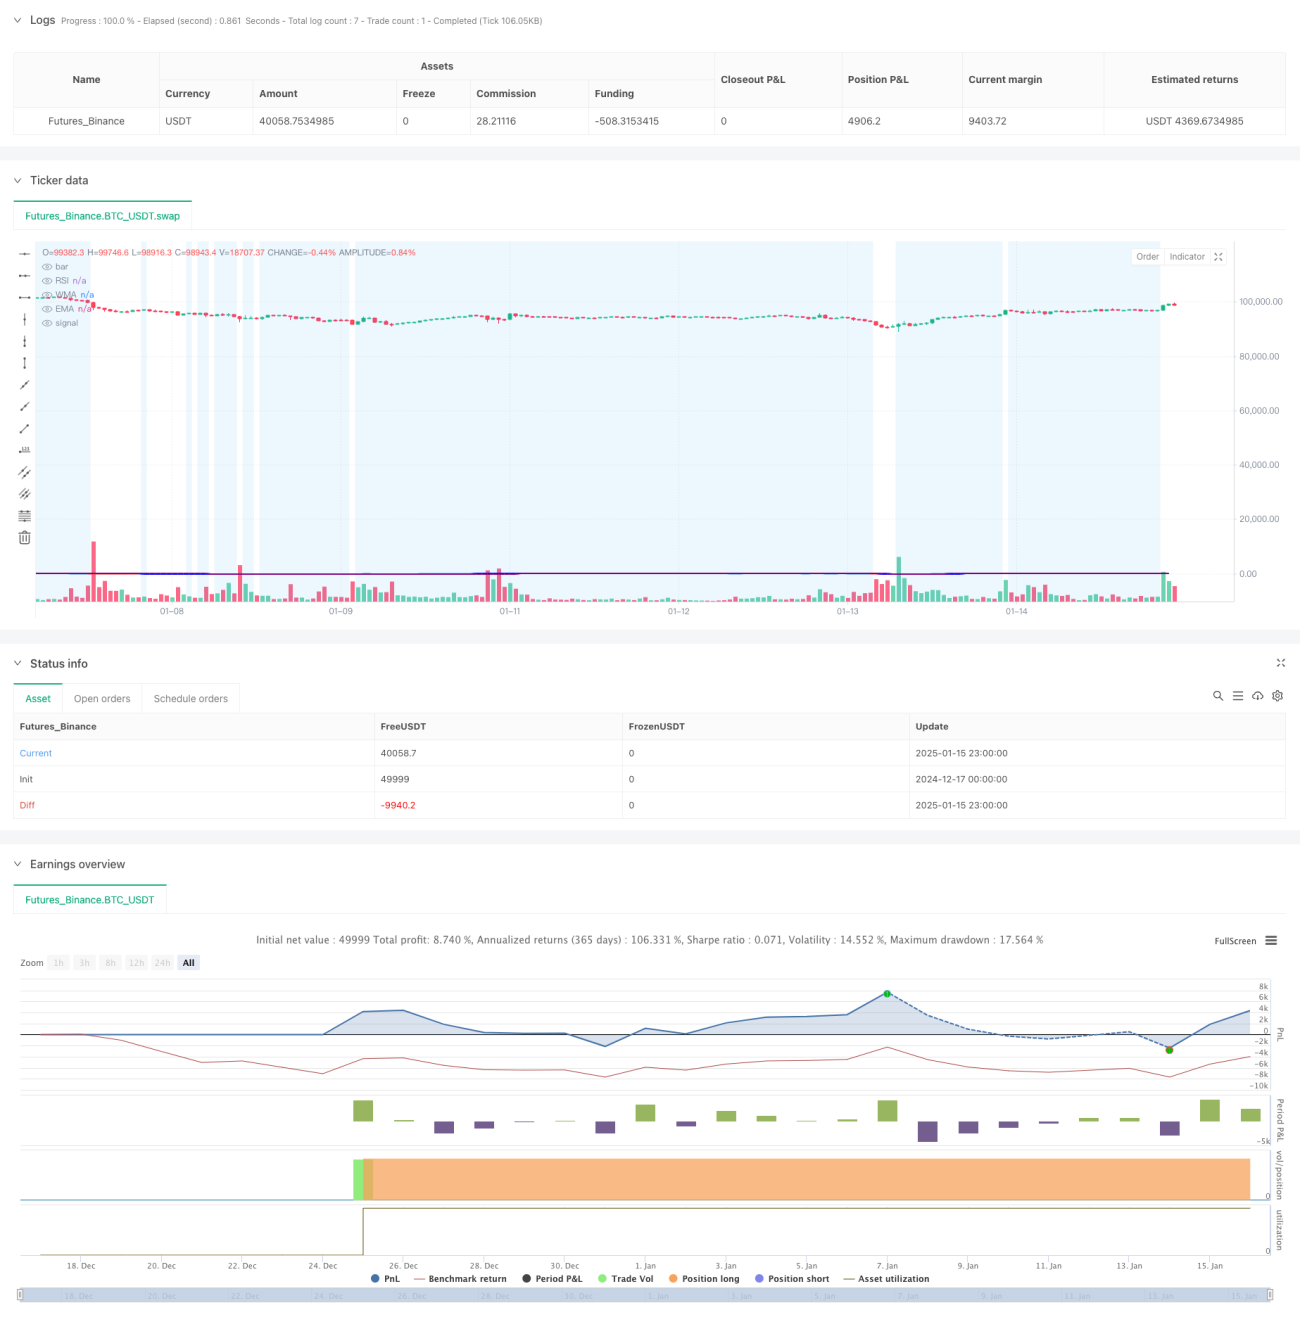
この戦略は、相対力指数 (RSI)、加重移動平均 (WMA)、指数移動平均 (EMA) を組み合わせたトレンド追従型取引システムです。この戦略では、複数のテクニカル指標を連携させて使用し、トレンドの転換点における市場の勢いの変化を捉え、取引シグナルを生成します。このシステムは、WMA と EMA のクロスオーバーを使用してトレンドの方向を確認し、RSI インジケーターを組み合わせて市場の状況をフィルタリングし、取引の精度を向上させます。
戦略原則
戦略の中核となるロジックは、次の主要な要素に基づいています。
- RSI インジケーターは、市場の買われすぎと売られすぎの状態を測定するために 14 期間を使用して計算されます。
- 45 期間の WMA と 89 期間の EMA のクロスオーバーは、トレンドの変化を確認するために使用されます。
- 応募条件:
- ロングシグナル: WMAがEMAを上回り、RSI < 50
- ショートシグナル: WMAがEMAを下回り、RSI>50
- システムは、RSI の色の変化を通じて市場の状況を視覚化します。RSI > 70 の場合は緑色で表示され、RSI < 30 の場合は赤色で表示されます。
- RSI 30~70の範囲では、中立領域を識別するために青い背景が設定されます。
戦略的優位性
- 複数のテクニカル指標を組み合わせることで、取引シグナルの信頼性が向上します。
- WMA は最近の価格変動に敏感ですが、EMA は長期的なトレンドを追跡し続けています。
- RSIは、過度に不安定な市場で誤ったシグナルを効果的に回避するためのフィルターとして機能します。
- 視覚的なインターフェース設計により、トレーダーは市場の状況を直感的に判断できます。
- トレーダーに潜在的な取引機会を迅速に通知する完全なアラートシステムが含まれています
戦略リスク
- 横ばい市場では、誤ったブレイクアウトシグナルが頻繁に発生する可能性がある
- 移動平均の遅れにより、エントリータイミングが若干遅れる可能性がある。
- RSIしきい値の固定設定は、すべての市場環境で適切ではない可能性があります。
- ボラティリティ要因を考慮しないと、ボラティリティが高い時期にリスクが増大する可能性がある。
- ストップロスとストッププロフィットのメカニズムの欠如は、ファンド管理効果に影響を与える可能性があります。
戦略最適化の方向性
- 市場のボラティリティに応じて動的に調整される適応型RSIしきい値を導入
- ATRインジケーターを追加してポジションサイズを制御し、動的なストップロスを設定します。
- WMAとEMAの期間設定を最適化し、異なる時間枠に応じて調整することを検討してください。
- 補助的な確認信号としてボリュームインジケーターを追加
- ピラミッド化やポジション削減などのより複雑なポジション管理システムを実装する
要約する
複数のテクニカル指標に基づくトレンド追跡戦略です。RSI、WMA、EMAを連携して使用することで、取引の安定性を確保しながら、市場のトレンド転換点を捉えることを目指します。一定のヒステリシスと誤信号のリスクはあるものの、合理的な最適化とリスク管理措置により、この戦略は優れた実用価値と拡張の余地を持っています。
Source
Pine
Strategy parameters
Related strategies
Comment
All comments (0)
No data
- 1