高度なマルチインジケータートレンド確認取引戦略

1
Follow
1781
Followers
概要
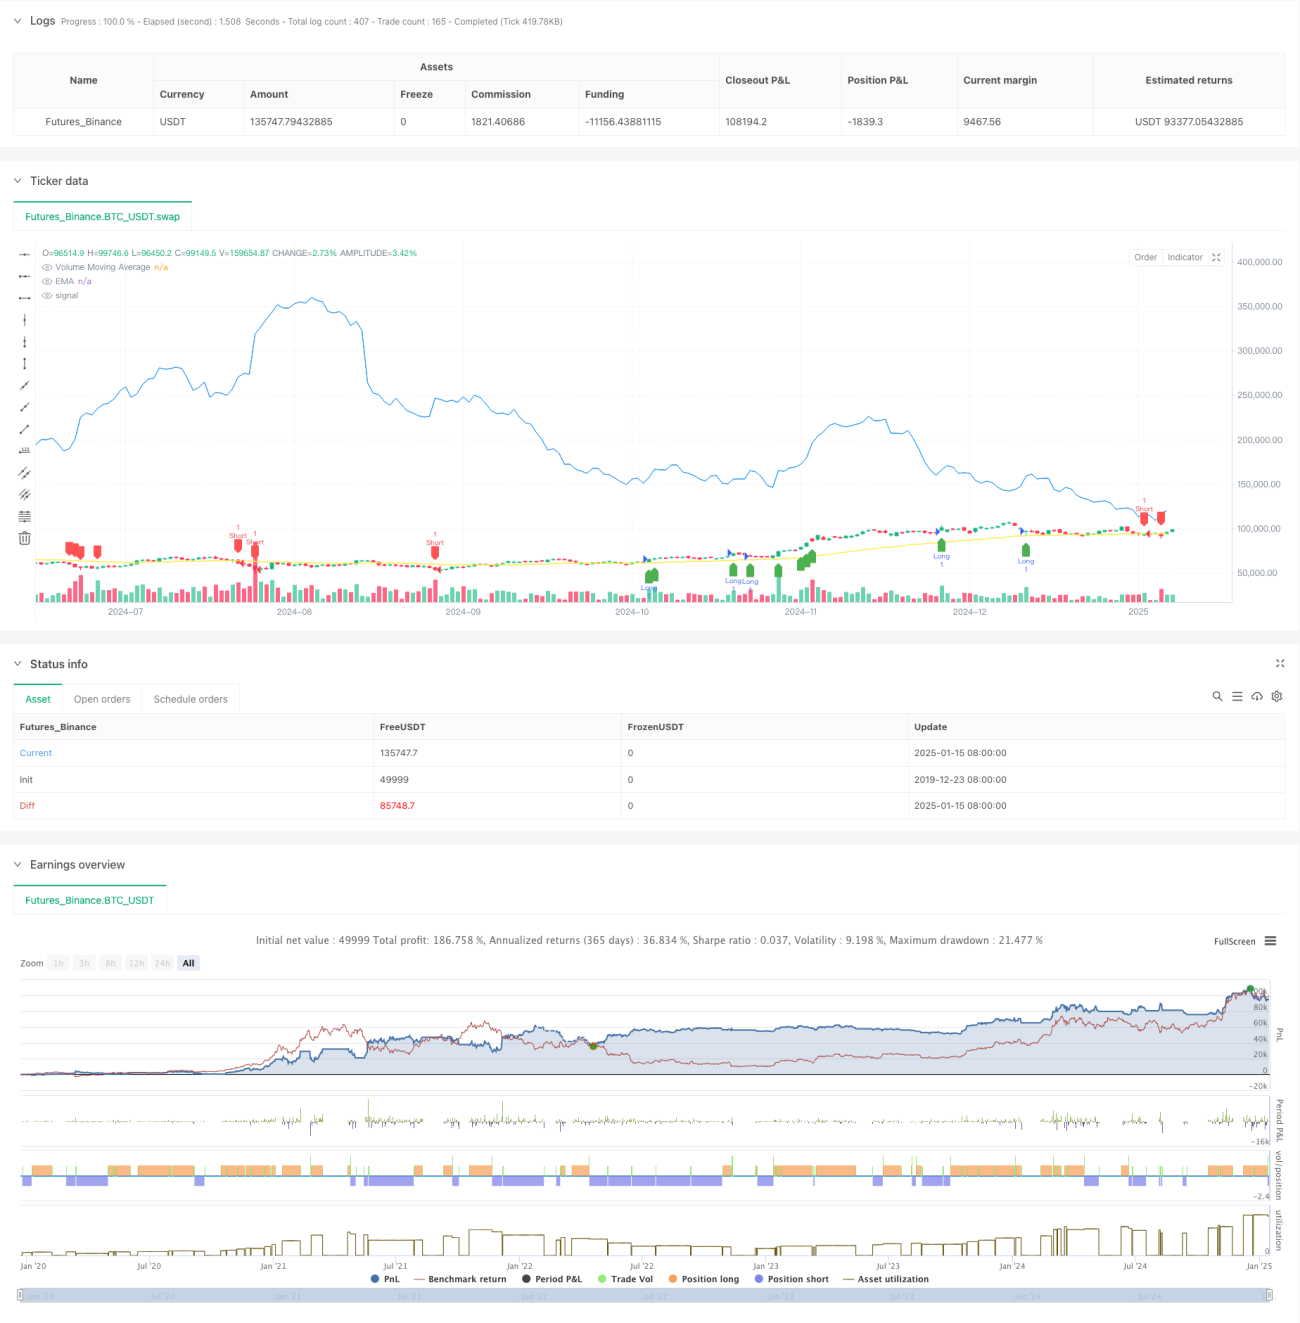
これは、指数移動平均 (EMA)、ボリューム確認、平均トレンド率 (ATR) インジケーターを組み合わせた高度な定量取引戦略です。この戦略は、複数のテクニカル指標を使用して市場動向を正確に把握するだけでなく、ボリューム確認を通じて取引の信頼性を向上させます。同時に、ATRを使用してストップロスとテイクプロフィットのポジションを動的に調整し、包括的なリスク管理システムを実現します。 。
戦略原則
戦略の中核となるロジックは、次の 3 つの主要な部分から構成されます。
- トレンド判定:トレンド判定の主な指標としてEMA(50)を使用します。価格が EMA を上回っている場合は上昇傾向と見なされ、そうでない場合は下降傾向と見なされます。
- ボリュームの確認: 20 期間のボリューム移動平均 (Volume MA) を計算すると、現在のボリュームが移動平均の 1.5 倍であるだけでなく、前の期間のボリュームよりも大きくなければならず、市場に十分な参加支出があることを確認します。
- リスク管理: 14 期間の ATR に基づいて、ストップ ロスと利益確定のポジションを動的に設定します。ストップロスはATRの2倍に設定され、テイクプロフィットはATRの3倍に設定されています。この設定は資金の安全性を保護するだけでなく、トレンドが十分に発展する余地を与えます。
戦略的優位性
- 多重確認メカニズム: トレンドとボリュームの二重確認により、取引シグナルの信頼性が大幅に向上します。
- 動的リスク管理: 動的なストップロスとテイクプロフィットの設定に ATR を使用すると、市場のボラティリティの変化に適応しやすくなります。
- 高い柔軟性: 戦略パラメータはさまざまな市場状況に応じて調整でき、適応性も高くなります。
- 明確な視覚化: この戦略は明確なグラフィカル信号表示を提供し、トレーダーが直感的な判断を下すことを容易にします。
戦略リスク
- トレンド反転リスク: 不安定な市場状況では、EMA が遅れ、シグナルが遅れる可能性があります。
- 取引量による偽のブレイクアウト: 特定の特殊な市場状況では、取引量が多いことが偽のブレイクアウトの兆候である可能性があります。
- ストップロス範囲: 場合によっては、ATR の 2 倍のストップロス設定は大きく、調整を考慮する必要があります。
戦略最適化の方向性
- トレンド強度インジケーターの導入: トレンド判断の精度をさらに向上させるために、ADX などのトレンド強度インジケーターの追加を検討します。
- ボリューム フィルタリングを最適化: OBV やボリューム加重移動平均など、より複雑なボリューム分析方法を導入できます。
- ストップロス メカニズムを改善する: 移動ストップロスまたはサポート レベルとレジスタンス レベルに基づくストップロス メソッドを追加することを検討します。
- 時間フィルターの追加: 市場活動が低い期間中の誤ったシグナルを回避するために、取引期間フィルターを追加しました。
要約する
この戦略は、複数のテクニカル指標を総合的に使用することで、論理的に厳密な取引システムを確立します。この戦略の主な利点は、複数の確認メカニズムと動的なリスク管理にありますが、トレンドの反転や誤ったボリュームの突破などのリスクにも注意する必要があります。この戦略は継続的な最適化と改善を通じて、実際の取引でより良いパフォーマンスを達成することが期待されます。
Source
Pine
Strategy parameters
Related strategies
Comment
All comments (0)
No data
- 1