
1
Follow
1781
Followers
概要
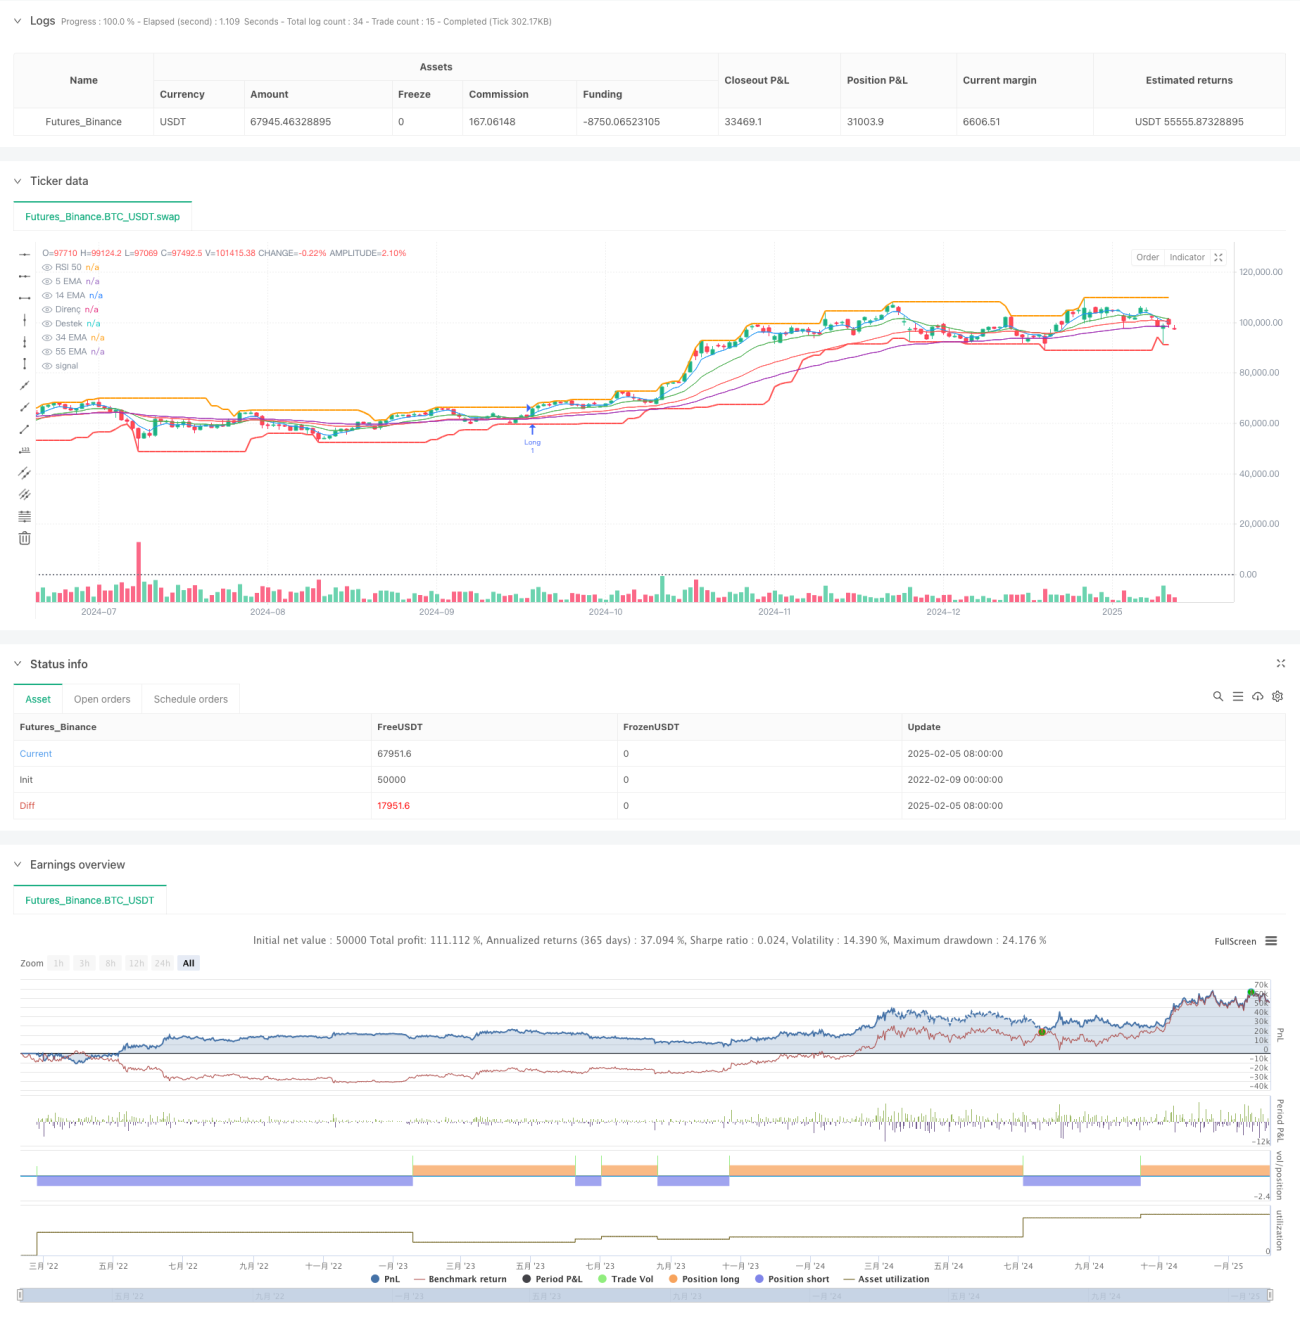
これは,移動平均 (EMA),MACD指標,RSI指標,取引量分析などの複数の技術指標を組み合わせた,複数の指標に基づいたトレンド追跡取引システムである.この戦略は,短期,中期,および長期の移動平均の関係性を分析し,移動量指標と取引量確認を組み合わせて,市場傾向が明確である場合に取引を行う.このシステムは,サポートとレジスタンス分析を導入し,取引の正確性をさらに向上させる.
戦略原則
戦略は以下の要素に基づいています.
- 多重EMAシステム:5,14,34,55周期のEMAを使用して,平均線を並べてトレンドの方向を確認する.短周期平均線が長周期平均線上にあるときは,上昇傾向とみなされ,逆に下降傾向とみなされる.
- MACD指標:市場の動態を確認するために使用される. MACD柱状図が正値であるときは,上昇動態が強いことを示し,負値である時は下降動態が強いことを示している.
- RSI指標:市場の強弱の確認指標である. RSI50以上は,市場が強い地域にあることを示し,50未満は,市場が弱い地域にあることを示している.
- 取引量分析:取引量が20サイクル取引量平均線の1.5倍以上であることを要求し,市場に十分な取引活動があることを保証する.
- サポートレジスタンスレベル: 20周期の最高価格と最低価格を計算して短期サポートレジスタンスレベルを決定する.
戦略的優位性
- 多次元分析:複数の技術指標を組み合わせることで,偽信号のリスクを低減する.
- トレンド確認:多重均線システムを使用し,市場動向をより正確に判断できます.
- 動力の検証:MACDとRSIの組み合わせにより,トレンドを確認し,上昇と低下を回避します.
- 量と価格の結合:取引の確認に必要な条件として取引量を取り入れることで,取引の信頼性が向上する.
- リスク管理: サポートの抵抗位の分析により,止損停止の参考を提供する.
戦略リスク
- 振動市場リスク:横盤振動市場では頻繁に偽信号が生じることがあります.
- 遅滞のリスク:複数の移動平均を使用しているため,戦略には一定の遅滞がある.
- コストリスク:頻繁に取引すると,取引コストが高くなる可能性があります.
- 市場環境依存:戦略は強いトレンドの市場ではうまく機能しますが,他の市場環境ではうまく機能しない可能性があります.
戦略最適化の方向性
- パラメータ最適化:各指標の周期パラメータを,歴史データで追及して最適化することができる.
- ストップ・オプティミゼーション:トラッキングストップまたはATRベースのストップのようなダイナミックなストップ・メカニズムを追加する.
- 市場環境分類:市場環境判断モジュールを追加し,異なる市場環境で異なる取引パラメータを使用する.
- 信号フィルター:トレンドの強さのフィルターを追加し,弱いトレンドの環境で取引を避ける.
- ポジション管理:信号強度に応じてポジション保持比率を調整するダイナミックなポジション管理メカニズムを導入.
要約する
この戦略は,総合的なトレンド追跡システムであり,複数の技術指標の配合使用によって,取引の信頼性を保証しながら,ある程度のリスク管理能力も備えている.戦略の核心的な優点は,多次元的な分析方法にあるが,同時に,市場環境が戦略のパフォーマンスに与える影響にも注意する必要がある.継続的な最適化と改善により,この戦略は実際の取引でより良いパフォーマンスを期待される.
Source
Pine
Strategy parameters
Related strategies
Comment
All comments (0)
No data
- 1