SMAとボリンジャーバンドに基づくエングルフィングパターンインジケーターの組み合わせ取引戦略

SMA BB RR TP SL
作成日: 2025-02-08 15:06:49 最終変更日: 2025-02-08 15:06:49
コピー: 2 クリック数: 338
1
フォロー
1617
フォロワー

SMAとボリンジャーバンドに基づくエングルフィングパターンインジケーターの組み合わせ取引戦略

概要

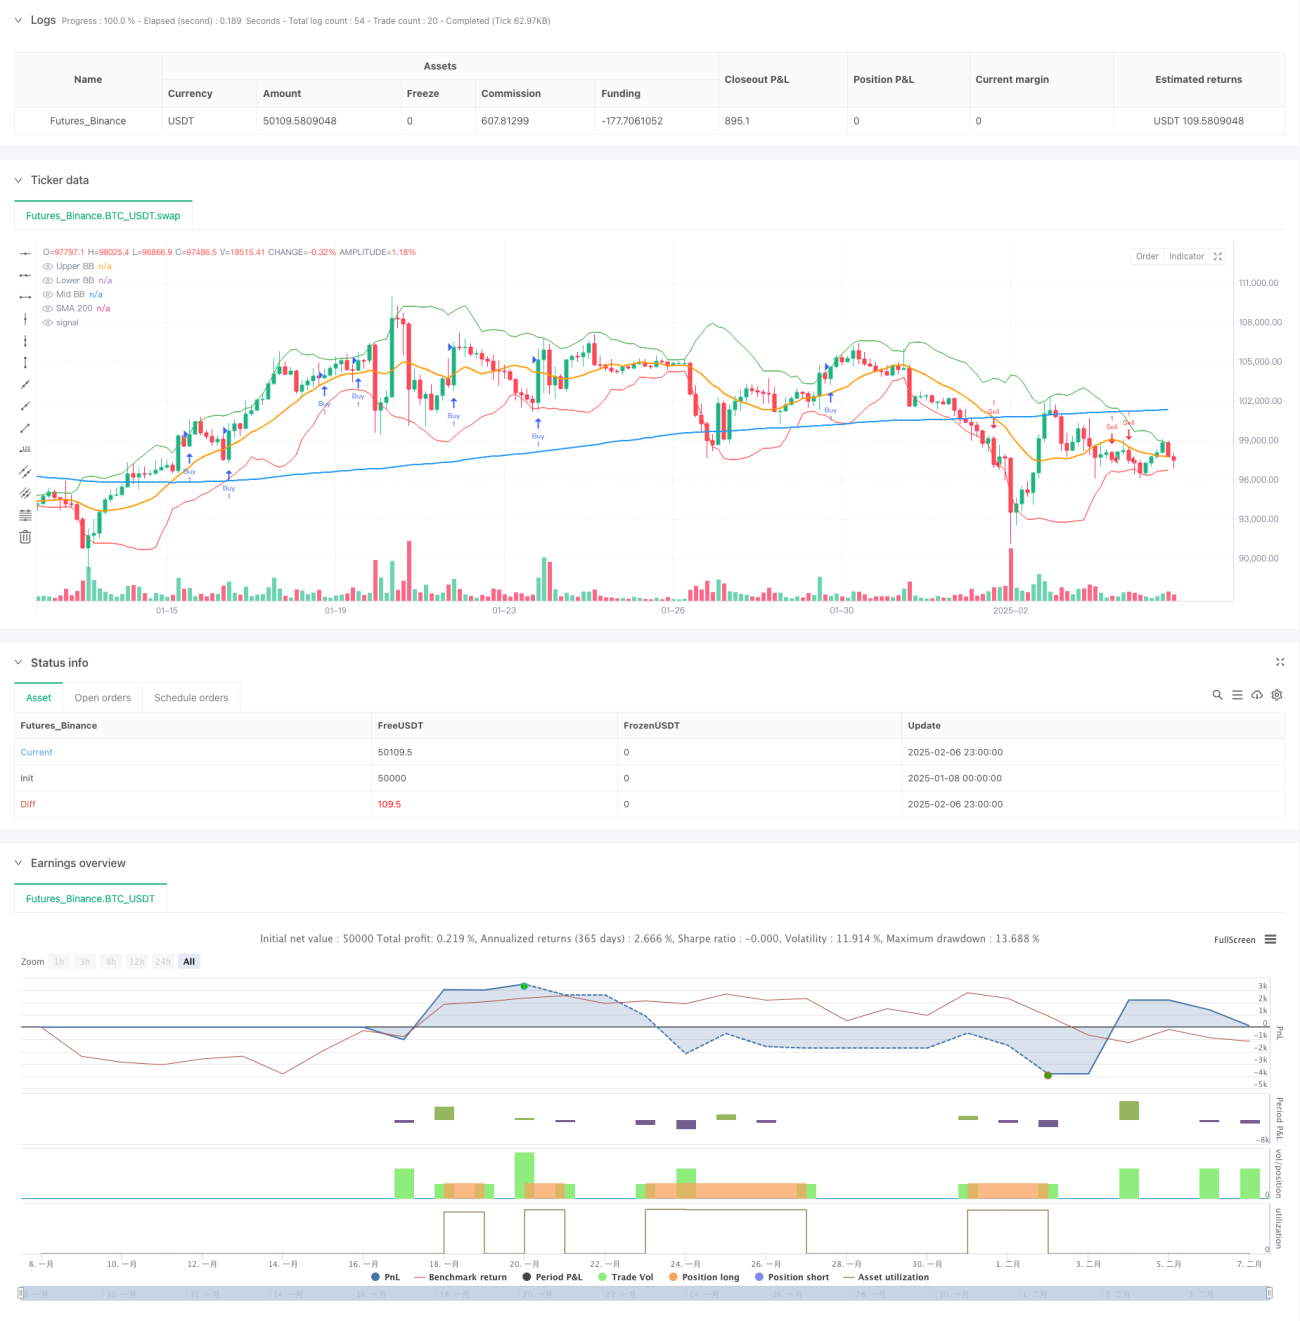
この戦略は,平均線 ((SMA),ブリン帯 ((BB) とK線形状を組み合わせたトレンド追跡取引システムである.この戦略は,主に,取引信号として吞食形状を識別し,200日平均線とブリン帯の中央軌道をトレンド確認指標として組み合わせ,リスクの:1:2のリスク収益比率を使用してリスクを制御する.

戦略原則

戦略の核心的な論理は,複数の技術指標の組み合わせによって取引シグナルを確認することです.具体的には:

  1. 200日平均線を用いて,全体的なトレンドの方向を決定する.
  2. ブリン帯中軌道を次元のトレンドとして確認
  3. 具体的入場機会を探し出すために 形状を飲み込む
  4. 固定1:2リスク/利益比で,ストップ・ロズとリターン・アゲインを設定する

価格が200日平均線とブリン帯中軌道上にある時,多頭ポジションを開きます. 相変わらず,価格が200日平均線とブリン帯中軌道下にある時,空頭ポジションを開きます.

戦略的優位性

  1. 複数の技術指標の組み合わせにより,取引信号の信頼性が向上
  2. クラシックなトレンドトラッキング指標を活用し,理解し,使いやすくする
  3. 固定リスク/利益の比率は,長期にわたる安定した利益に有利である.
  4. 明確な入場・出場ルールと主観的な判断の減少
  5. トレンド分析とダイナミクス分析の組み合わせにより,取引の成功率が向上しました.

戦略リスク

  1. 不安定な市場では誤ったシグナルが頻繁に発生する可能性がある
  2. 平均線とブリン帯は遅れの指標で,取引の機会を逃している可能性があります.
  3. 固定リスク/リターン比率は,すべての市場状況に適さない可能性があります.
  4. 市場が急激に波動する中で,一時停止の幅は広い可能性があります.
  5. 戦略の優位性を示すには,より大きなサンプルが必要です.

戦略最適化の方向性

  1. 市場変動の動向に合わせてリスク/利益の比率を調整することも考えられます.
  2. 補助確認としてボリュームインジケーターを追加
  3. 偽信号をフィルタリングするために他の技術指標を追加できます.
  4. 異なる時間周期における信号の協同性を考慮して入場タイミングを最適化する
  5. 戦略の適応性を高めるために,自己適応の指標パラメータを導入できます.

要約する

これは,構造が整った,論理が明確なトレンド追跡戦略である.均線,ブリン帯,吞食形態の組み合わせによる使用は,取引信号の信頼性を保証するとともに,明確なリスク管理方法を提供します.ある程度の遅滞があるが,全体的には操作性が強い,リスクが制御可能な取引システムである.

ストラテジーソースコード
/*backtest
start: 2025-01-08 00:00:00
end: 2025-02-07 00:00:00
period: 3h
basePeriod: 3h
exchanges: [{"eid":"Futures_Binance","currency":"BTC_USDT"}]
*/

// This Pine Script™ code is subject to the terms of the Mozilla Public License 2.0 at https://mozilla.org/MPL/2.0/
// © ardhankurniawan

//@version=5
//@version=5
strategy("Engulfing Candles Strategy with Risk-Reward 1:2 by ardhankurniawan", overlay = true)

// Menyimpan harga pembukaan dan penutupan dari candle sebelumnya dan saat ini
openBarPrevious = open[1]
closeBarPrevious = close[1]
openBarCurrent = open
closeBarCurrent = close

// Menghitung SMA 200
sma200 = ta.sma(close, 200)

// Menghitung Bollinger Bands (BB) dengan periode 14 dan standar deviasi 2
length = 14
src = close
mult = 2.0
basis = ta.sma(src, length)  // Mid Bollinger Band (SMA)
dev = mult * ta.stdev(src, length)  // Standard deviation
upperBB = basis + dev
lowerBB = basis - dev
midBB = basis  // Mid Bollinger Band adalah SMA

// Kondisi Bullish Engulfing: harga pembukaan saat ini lebih rendah dari harga penutupan sebelumnya, 
// harga pembukaan saat ini lebih rendah dari harga pembukaan sebelumnya, dan harga penutupan saat ini lebih tinggi dari harga pembukaan sebelumnya.
bullishEngulfing = (openBarCurrent <= closeBarPrevious) and (openBarCurrent < openBarPrevious) and (closeBarCurrent > openBarPrevious)

// Kondisi Bearish Engulfing: harga pembukaan saat ini lebih tinggi dari harga penutupan sebelumnya, 
// harga pembukaan saat ini lebih tinggi dari harga pembukaan sebelumnya, dan harga penutupan saat ini lebih rendah dari harga pembukaan sebelumnya.
bearishEngulfing = (openBarCurrent >= closeBarPrevious) and (openBarCurrent > openBarPrevious) and (closeBarCurrent < openBarPrevious)

// Kondisi untuk membeli (buy) hanya jika Bullish Engulfing terjadi di atas SMA 200 dan Mid Bollinger Band
buyCondition = bullishEngulfing and close > sma200 and close > midBB

// Kondisi untuk menjual (sell) hanya jika Bearish Engulfing terjadi di bawah SMA 200 dan Mid Bollinger Band
sellCondition = bearishEngulfing and close < sma200 and close < midBB

// Menghitung Stop Loss dan Take Profit dengan Risk-Reward Ratio 1:2
longSL = low  // SL di low candle bullish engulfing (prev low)
longRR = (close - low) * 2  // TP dengan Risk-Reward 1:2
longTP = close + longRR  // TP untuk posisi long

shortSL = high  // SL di high candle bearish engulfing (prev high)
shortRR = (high - close) * 2  // TP dengan Risk-Reward 1:2
shortTP = close - shortRR  // TP untuk posisi short

// Strategi Buy ketika kondisi beli terpenuhi dengan SL dan TP
if buyCondition
    strategy.entry("Buy", strategy.long)  // Perintah beli ketika Bullish Engulfing terjadi di atas SMA 200 dan Mid Bollinger Band
    strategy.exit("Sell Exit", from_entry = "Buy", stop = longSL, limit = longTP)  // SL dan TP untuk posisi long

// Strategi Sell ketika kondisi jual terpenuhi dengan SL dan TP
if sellCondition
    strategy.entry("Sell", strategy.short)  // Perintah jual ketika Bearish Engulfing terjadi di bawah SMA 200 dan Mid Bollinger Band
    strategy.exit("Buy Exit", from_entry = "Sell", stop = shortSL, limit = shortTP)  // SL dan TP untuk posisi short

// Menambahkan kondisi untuk keluar dari posisi
if sellCondition
    strategy.close("Buy")  // Menutup posisi beli jika Bearish Engulfing terjadi di bawah SMA 200 dan Mid Bollinger Band
if buyCondition
    strategy.close("Sell")  // Menutup posisi jual jika Bullish Engulfing terjadi di atas SMA 200 dan Mid Bollinger Band

// Plotting SMA 200 dan Bollinger Bands
plot(sma200, color = color.blue, linewidth = 2, title = "SMA 200")
plot(upperBB, color = color.green, linewidth = 1, title = "Upper BB")
plot(lowerBB, color = color.red, linewidth = 1, title = "Lower BB")
plot(midBB, color = color.orange, linewidth = 2, title = "Mid BB")

// Alert condition
alertcondition(buyCondition, title = "Bullish Engulfing Above SMA 200 and Mid BB", message = "[CurrencyPair] [TimeFrame], Bullish Engulfing above SMA 200 and Mid Bollinger Band")
alertcondition(sellCondition, title = "Bearish Engulfing Below SMA 200 and Mid BB", message = "[CurrencyPair] [TimeFrame], Bearish Engulfing below SMA 200 and Mid Bollinger Band")