高度なマルチトレンド確認EMA需給ゾーンダイナミックアービトラージ戦略

EMA ATR SMA VOLUME
作成日: 2025-02-08 15:08:21 最終変更日: 2025-02-08 15:08:21
コピー: 0 クリック数: 406
1
フォロー
1617
フォロワー

高度なマルチトレンド確認EMA需給ゾーンダイナミックアービトラージ戦略

概要

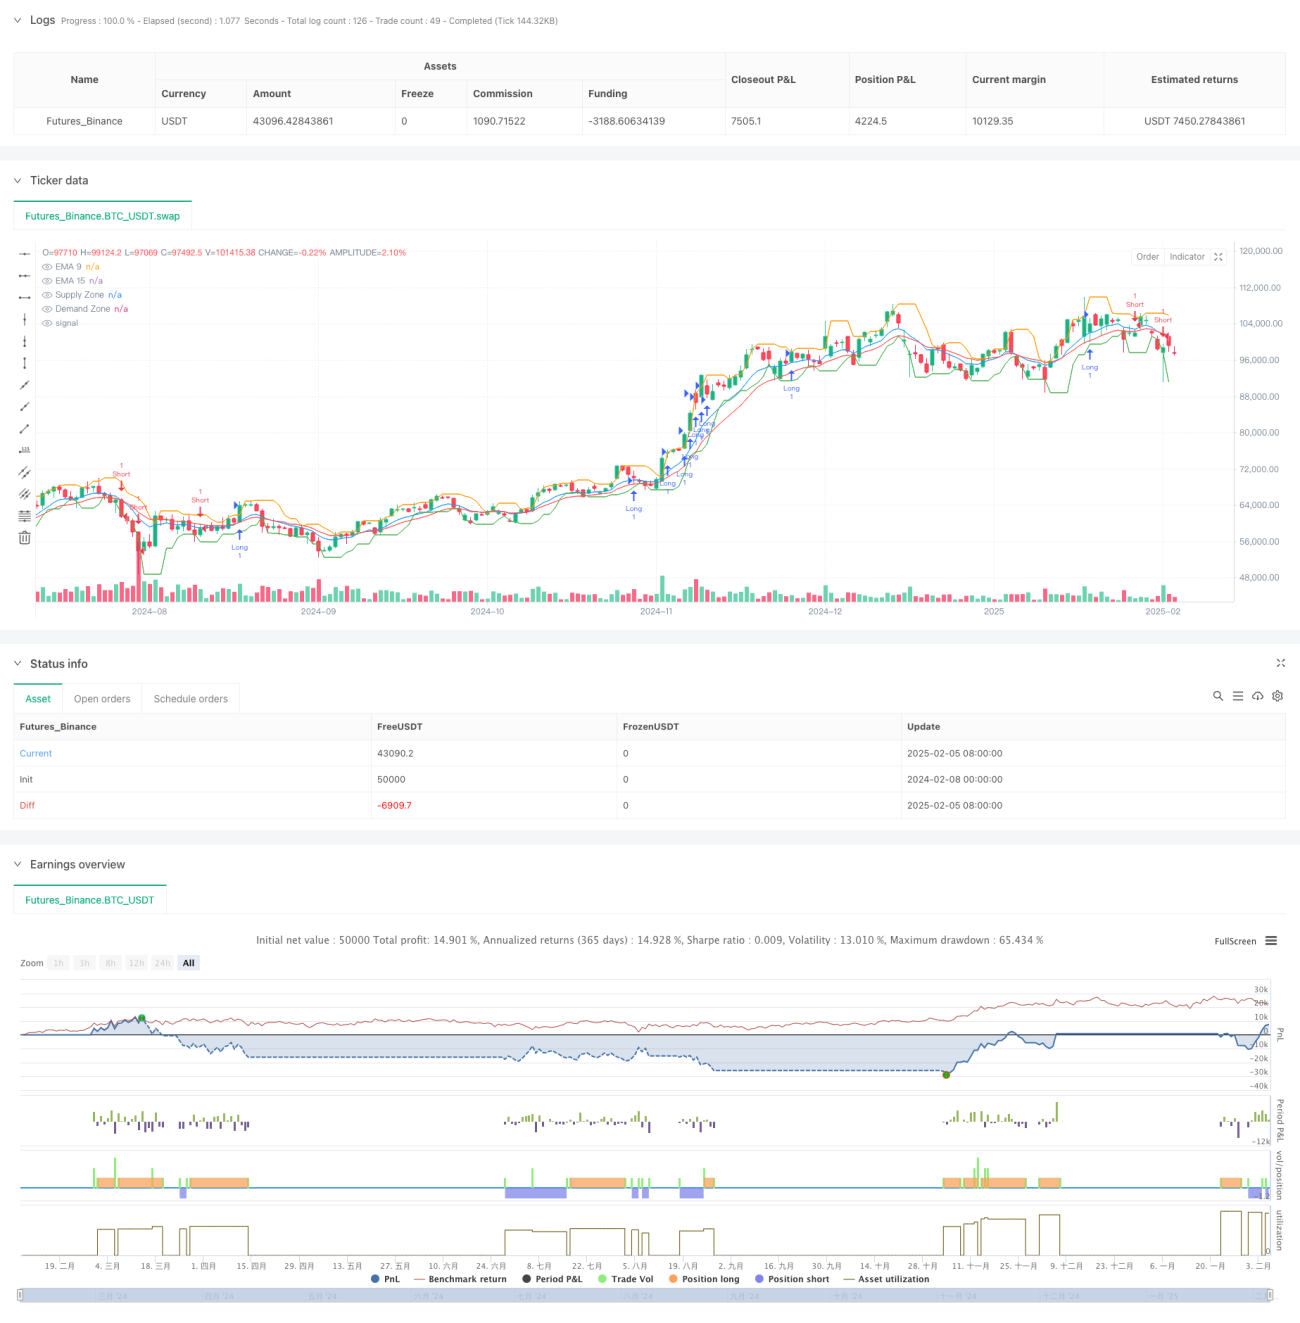
この戦略は,平均線 (EMA),需要区間,取引量を組み合わせた高度な自己適応性アバरेज戦略である.それは,複数の技術指標の交叉確認によって市場の傾向を認識し,重要な需要区間の近くで取引する.この戦略は,ダイナミックな止損と利益の目標を採用し,ATR指標によって市場の変動に適応する.

戦略原則

戦略の中核となるロジックは、次の主要な要素に基づいています。

  1. 9サイクルと15サイクルEMAのトレンド方向を主要取引信号として使用
  2. より高い時間枠 (15分) の需要・供給領域で重要な価格レベルを決定する
  3. トレンドの有効性を検証する取引量確認
  4. ATRベースの動的ストップと利益目標を使用してリスクを管理する
  5. 複数の条件が同時に満たされている場合にのみ取引を行う.

具体的には,9周期EMAが3連周期上昇し,15周期EMAも上昇傾向にあり,価格が需要領域の上にあり,20周期取引量平均線が50周期取引量平均線より大きいとき,システムは多信号を発する.空信号の論理は逆である.

戦略的優位性

  1. 多重認証メカニズムにより取引の信頼性が著しく向上
  2. ダイナミックなストップ・ロズと利益目標が,異なる市場環境に対応する
  3. 供給・需要の領域をフィルターすることで,不利な価格領域での取引を避ける
  4. 取引量確認により,トレンドの確認が追加されます.
  5. リスク/利益の比率は,市場の状況に応じて柔軟に調整できます.
  6. 戦略は,異なる市場条件に適した自律性がある

戦略リスク

  1. 波動の激しい市場では,偽の信号が出る可能性があります.
  2. 複数の確認条件により,取引の機会を逃す可能性があります.
  3. 供給・需要の地域を特定する際の遅れ
  4. 横軸市場では頻繁に取引信号が生じる可能性があります.

リスク管理措置:

  • 動的ATRストップを使用して市場の波動に適応する
  • 取引量確認で偽信号をフィルターする
  • リスク・リターン・レート・コントロールの厳格な実施
  • 重要な価格帯の近くで取引する

戦略最適化の方向性

  1. 市場波動に合わせて自動的に調整できるように,自己適応のEMAサイクルを導入
  2. 市場状況認識モジュールを追加し,異なる市場環境で異なるパラメータを使用
  3. 供給・需要地域の計算方法の最適化,識別の正確性の向上
  4. 市場マイクロ構造分析の追加
  5. ダイナミックな開発のリスクと利益の比較

要約する

これは,複数の技術分析ツールを統合した完全な取引システムであり,複数の確認機構によって取引の信頼性を高めています.戦略の優点は,自主性とリスク管理能力にありますが,同時に,異なる市場環境でのパフォーマンスの違いにも注意する必要があります.提案された最適化の方向によって,この戦略はさらに向上する余地があります.

ストラテジーソースコード
/*backtest
start: 2024-02-08 00:00:00
end: 2025-02-06 08:00:00
period: 1d
basePeriod: 1d
exchanges: [{"eid":"Futures_Binance","currency":"BTC_USDT"}]
*/

//@version=5
strategy("Optimized Scalping Strategy with EMA & Supply/Demand Zones", overlay=true)

// Inputs
ema9_length = input(9, title="EMA 9 Length")
ema15_length = input(15, title="EMA 15 Length")
higher_tf = input.timeframe("15", title="Higher Timeframe for Zones")
atr_mult = input(1.5, title="ATR Multiplier for Stop Loss")
risk_reward = input.float(1.2, title="Risk-Reward Ratio", options=[1.2, 1.3, 1.4])

// Calculating EMAs
ema9 = ta.ema(close, ema9_length)
ema15 = ta.ema(close, ema15_length)

// Function to detect supply & demand zones
get_zone(tf) =>
    high_tf_high = request.security(syminfo.tickerid, tf, ta.highest(high, 50))
    high_tf_low = request.security(syminfo.tickerid, tf, ta.lowest(low, 50))
    [high_tf_high, high_tf_low]

[supply_zone, demand_zone] = get_zone(higher_tf)

// ATR-based Stop Loss and Take Profit
atr = ta.atr(14)
long_sl = close - (atr * atr_mult)
long_tp = close + (atr * atr_mult * risk_reward)
short_sl = close + (atr * atr_mult)
short_tp = close - (atr * atr_mult * risk_reward)

// Entry conditions with volume and trend confirmation
longCondition = ta.rising(ema9, 3) and ta.rising(ema15, 3) and close > demand_zone and ta.sma(volume, 20) > ta.sma(volume, 50)
shortCondition = ta.falling(ema9, 3) and ta.falling(ema15, 3) and close < supply_zone and ta.sma(volume, 20) > ta.sma(volume, 50)

// Exit conditions using ATR-based SL/TP with additional trend confirmation
exitLong = (close >= long_tp or close <= long_sl) and ta.falling(ema9, 2)
exitShort = (close <= short_tp or close >= short_sl) and ta.rising(ema9, 2)

// Executing trades with improved risk management
if longCondition
    strategy.entry("Long", strategy.long)
    strategy.exit("Long Exit", from_entry="Long", stop=long_sl, limit=long_tp)
if shortCondition
    strategy.entry("Short", strategy.short)
    strategy.exit("Short Exit", from_entry="Short", stop=short_sl, limit=short_tp)

// Plotting
plot(ema9, color=color.blue, title="EMA 9")
plot(ema15, color=color.red, title="EMA 15")
plot(supply_zone, color=color.orange, title="Supply Zone")
plot(demand_zone, color=color.green, title="Demand Zone")