1
フォロー
1750
フォロワー
概要
この戦略は,複数の指数移動平均 (EMA) と相対的に強い指標 (RSI) に基づくトレンド追跡取引システムである. この戦略は,日線レベルのEMA (20,30,200) の交差信号,RSIの動態確認,およびダイナミックストップメカニズムを組み合わせて,市場における長期的なトレンドの機会を捉えることを目的としている.
戦略原則
戦略の中核となるロジックには、次の主要なコンポーネントが含まれます。
- 入場シグナル:当日線20日EMAが30日EMAを向上して通過し,価格が200日EMA上にあり,同時にRSIが50より大きいとき,システムは多行シグナルを生成する。
- 止まる設定:入場後に50%の固定止まる位置を設定する.
- ダイナミックストップ:25%のダイナミック・トラッキングストップを使用し,価格の革新が高くなるにつれてストップ・ポジションを上へと移動する.
- 退場メカニズム:価格がストップポイントまたはトラッキングストップポイントに触れたときに,自動平仓で取引を終了する.
戦略的優位性
- 複数のタイムサイクル検証:日線レベルの均線組合せによって短期変動をフィルタリングし,取引の安定性を高める.
- ダイナミックなリスクマネジメント: ストップ・ロスを追跡することで,収益を効果的にロックし,大幅な撤退を回避できます.
- トレンド確認:RSIは平均線システムと組み合わせて,トレンドの有効性をよりよく確認できます.
- 論理的な実行: 入場・出場条件が明確で,理解・操作が容易である.
戦略リスク
- 振動市場リスク:横盤振動市場では,頻繁にストップをトリガーすることがあります.
- スライドポイントの影響: 市場が激しく波動する時には,ダイナミックなストープとストップポジットが大きなスライドポイントに直面する可能性があります.
- 偽突破リスク:均線交差信号が偽突破される可能性がある.
- パラメータの感受性: ストップ損失とストップ停止パーセントの設定は,戦略のパフォーマンスに大きな影響を与える.
戦略最適化の方向性
- 市場環境フィルター:波動率指標 (ATRなど) を追加して,市場環境を判断し,波動的な市場ではポジションを下げたり,取引を一時停止したりする.
- ストップを動態化:市場の変動に応じてストップ比率を動態的に調整することを検討する.
- 入場信号の最適化:交差量指標を導入して均線交差信号に合わせて信号の信頼性を向上させる.
- ポジション管理の改善:市場リスクに応じてポジション開設規模を自動的に調整するダイナミックなポジション管理メカニズムを導入.
要約する
この戦略は,複数の技術指標の協調的な配合によって,完全なトレンド追跡取引システムを構築する.戦略の主要な特徴は,中長期のトレンド判断とダイナミックなリスク管理を組み合わせ,トレンドが明瞭な市場環境で動作するのに適しています.継続的な最適化と改善により,戦略は実際の取引でより良いパフォーマンスを期待しています.
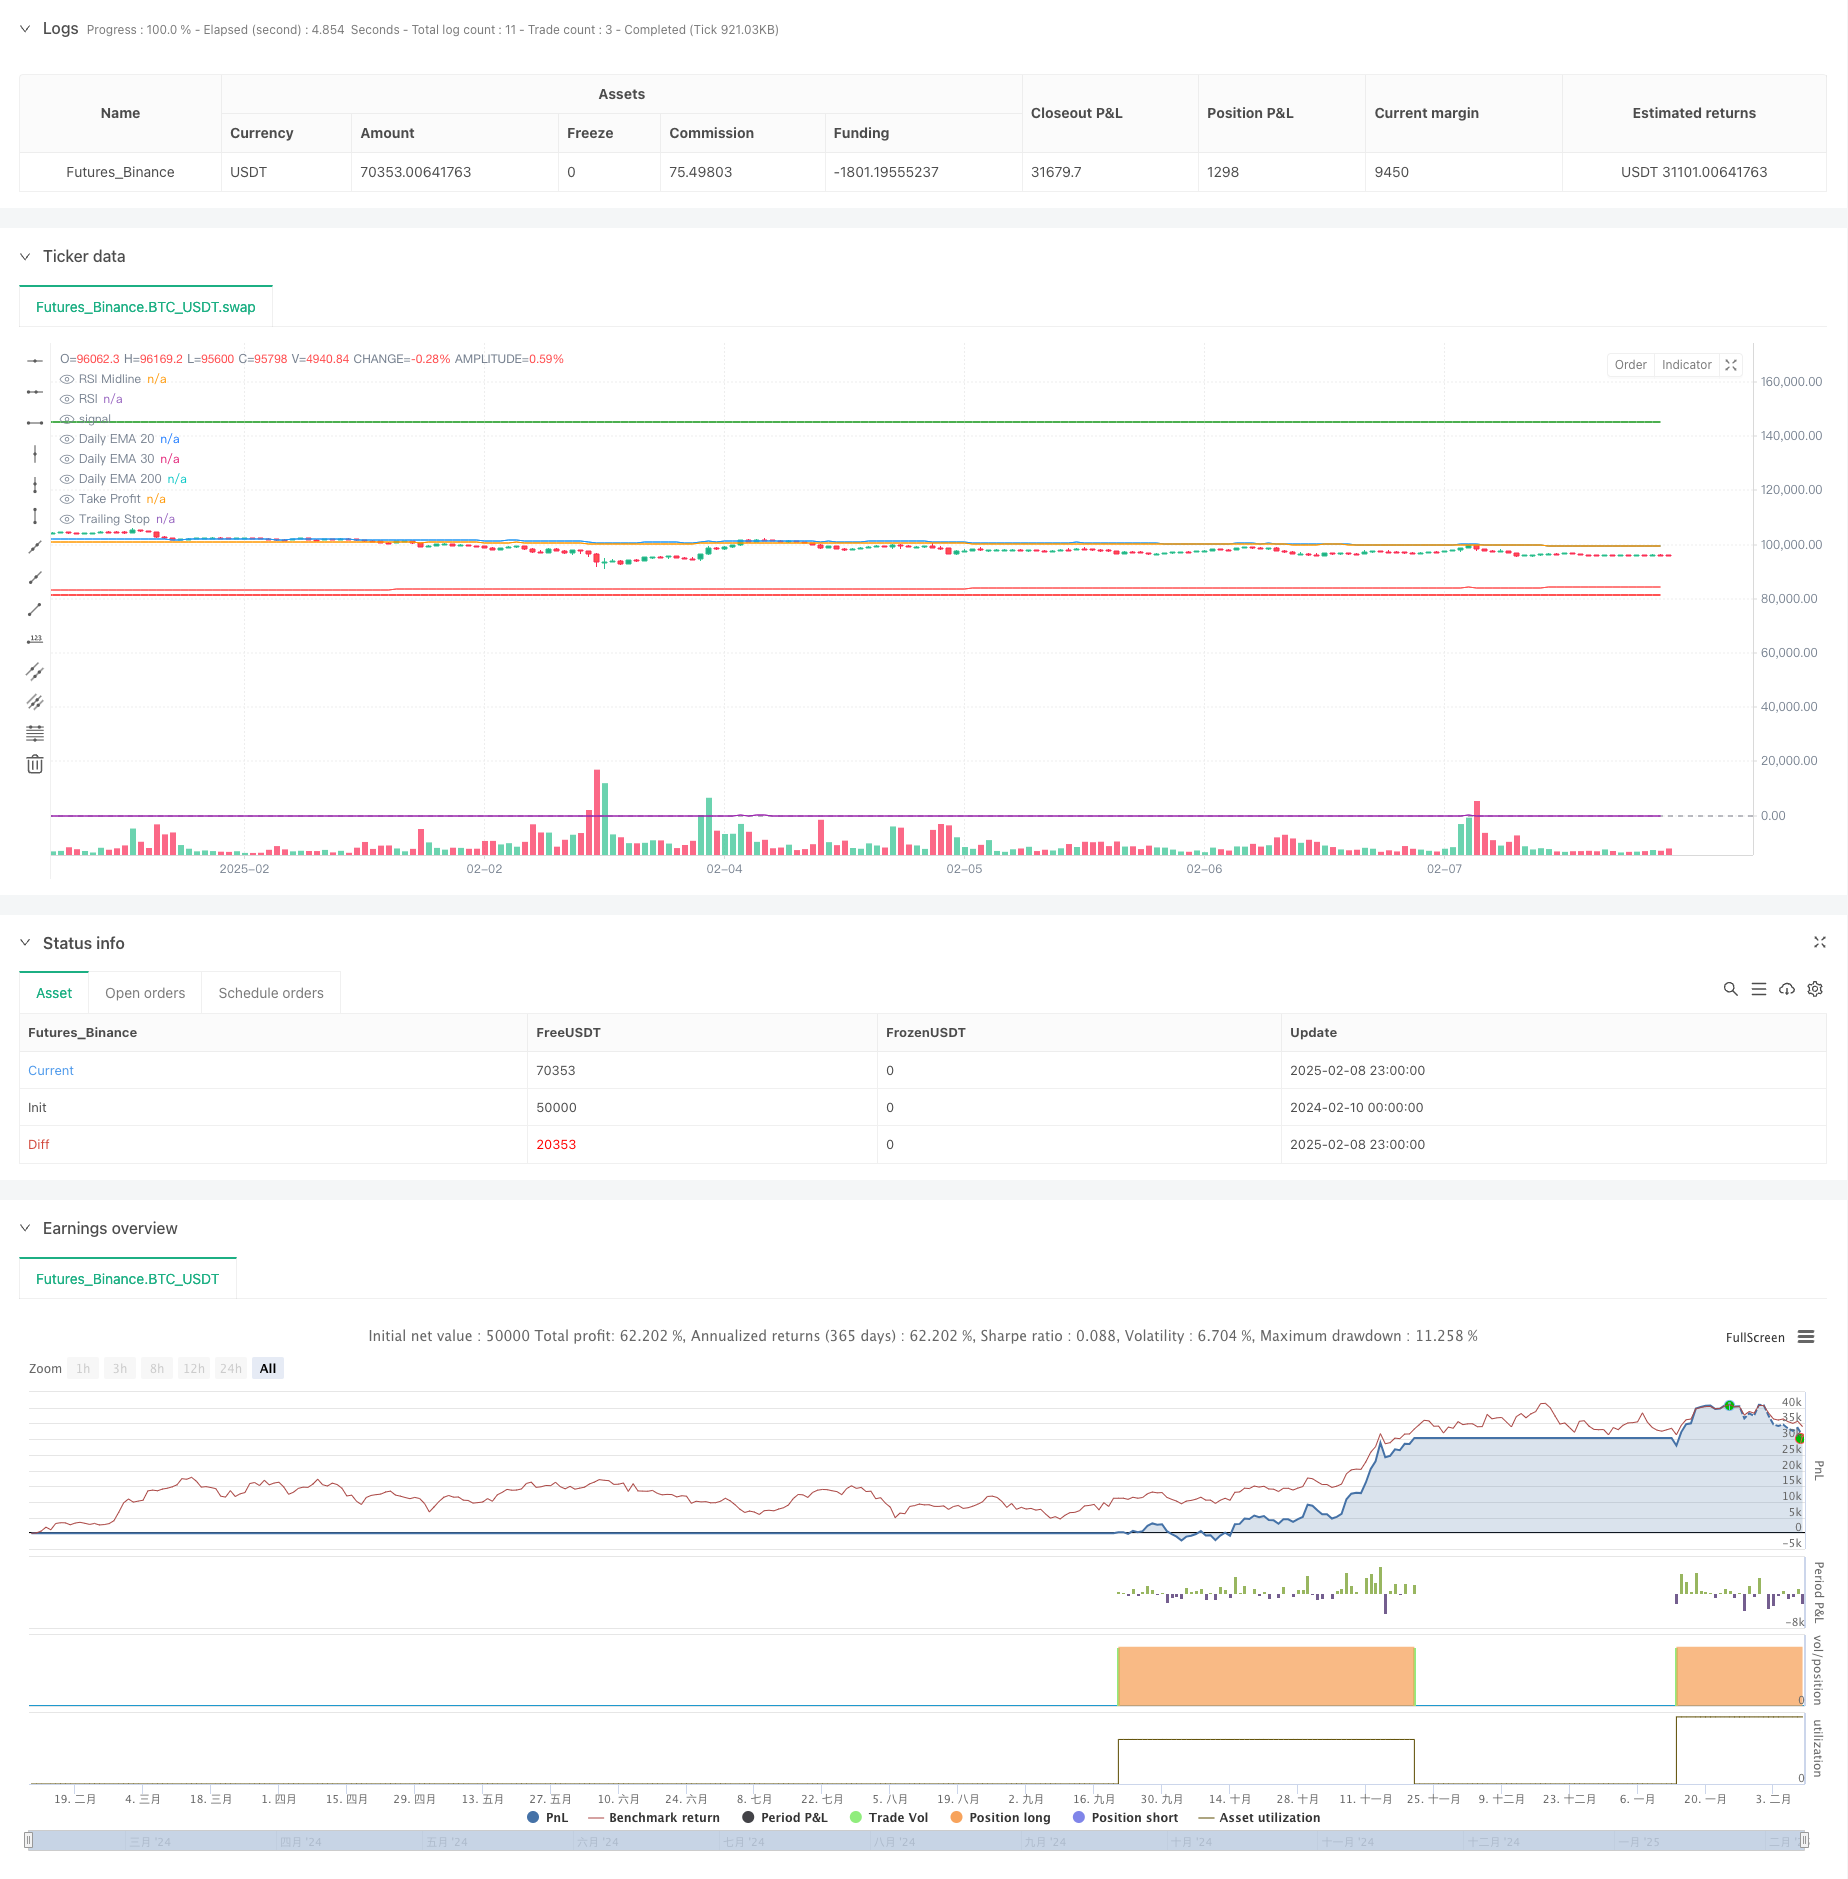
ストラテジーソースコード
/*backtest
start: 2024-02-10 00:00:00
end: 2025-02-09 00:00:00
period: 1h
basePeriod: 1h
exchanges: [{"eid":"Futures_Binance","currency":"BTC_USDT"}]
*/

//@version=5
strategy("Talbuaia Signal", overlay=true)

// Request EMAs on the daily timeframe
ema20_daily = request.security(syminfo.tickerid, "D", ta.ema(close, 20), lookahead=barmerge.lookahead_on)
ema30_daily = request.security(syminfo.tickerid, "D", ta.ema(close, 30), lookahead=barmerge.lookahead_on)
ema200_daily = request.security(syminfo.tickerid, "D", ta.ema(close, 200), lookahead=barmerge.lookahead_on)

// RSI Calculation
rsi = ta.rsi(close, 14)

// Plot daily EMAs
plot(ema20_daily, color=color.blue, title="Daily EMA 20")
plot(ema30_daily, color=color.orange, title="Daily EMA 30")
plot(ema200_daily, color=color.red, title="Daily EMA 200")

// Plot RSI
hline(50, "RSI Midline", color=color.gray)
plot(rsi, color=color.purple, title="RSI")

// Entry condition: 20 EMA crosses above 30 EMA, price is above 200 EMA, and RSI > 50
bullishEntry = ta.crossover(ema20_daily, ema30_daily) and close > ema200_daily and rsi > 50

// Variables to track entry price, take profit, and trailing stop
var float entryPriceLong = na
var float highestPriceSinceEntry = na
var float takeProfitLevel = na
var float trailingStopLevel = na

// Entry Logic
if bullishEntry
    strategy.entry("Long", strategy.long)
    entryPriceLong := close
    highestPriceSinceEntry := close  // Initialize the highest price since entry
    takeProfitLevel := entryPriceLong * 1.50  // Set take profit at 50% above entry price
    trailingStopLevel := na  // Reset trailing stop
    label.new(bar_index, close, "BUY", style=label.style_label_up, color=color.green, textcolor=color.white)

// Update highest price and trailing stop dynamically
if strategy.position_size > 0
    highestPriceSinceEntry := math.max(highestPriceSinceEntry, close)  // Track the highest price reached
    trailingStopLevel := highestPriceSinceEntry * (1 - 0.25)  // Set trailing stop at 25% below the highest price

// Exit Logic: Take profit or trailing stop
if strategy.position_size > 0 and (close >= takeProfitLevel or close <= trailingStopLevel)
    strategy.close("Long")
    label.new(bar_index, close, "EXIT LONG", style=label.style_label_down, color=color.red, textcolor=color.white)

// Plot trailing stop and take profit levels on the chart
plot(trailingStopLevel, "Trailing Stop", color=color.red, linewidth=2, style=plot.style_line)
plot(takeProfitLevel, "Take Profit", color=color.green, linewidth=2, style=plot.style_line)