多期間市場疲労分析戦略とリスク管理システム

ATR RRR SL TP DD
作成日: 2025-02-10 14:27:15 最終変更日: 2025-02-10 14:27:15
コピー: 1 クリック数: 370
1
フォロー
1617
フォロワー

多期間市場疲労分析戦略とリスク管理システム

概要

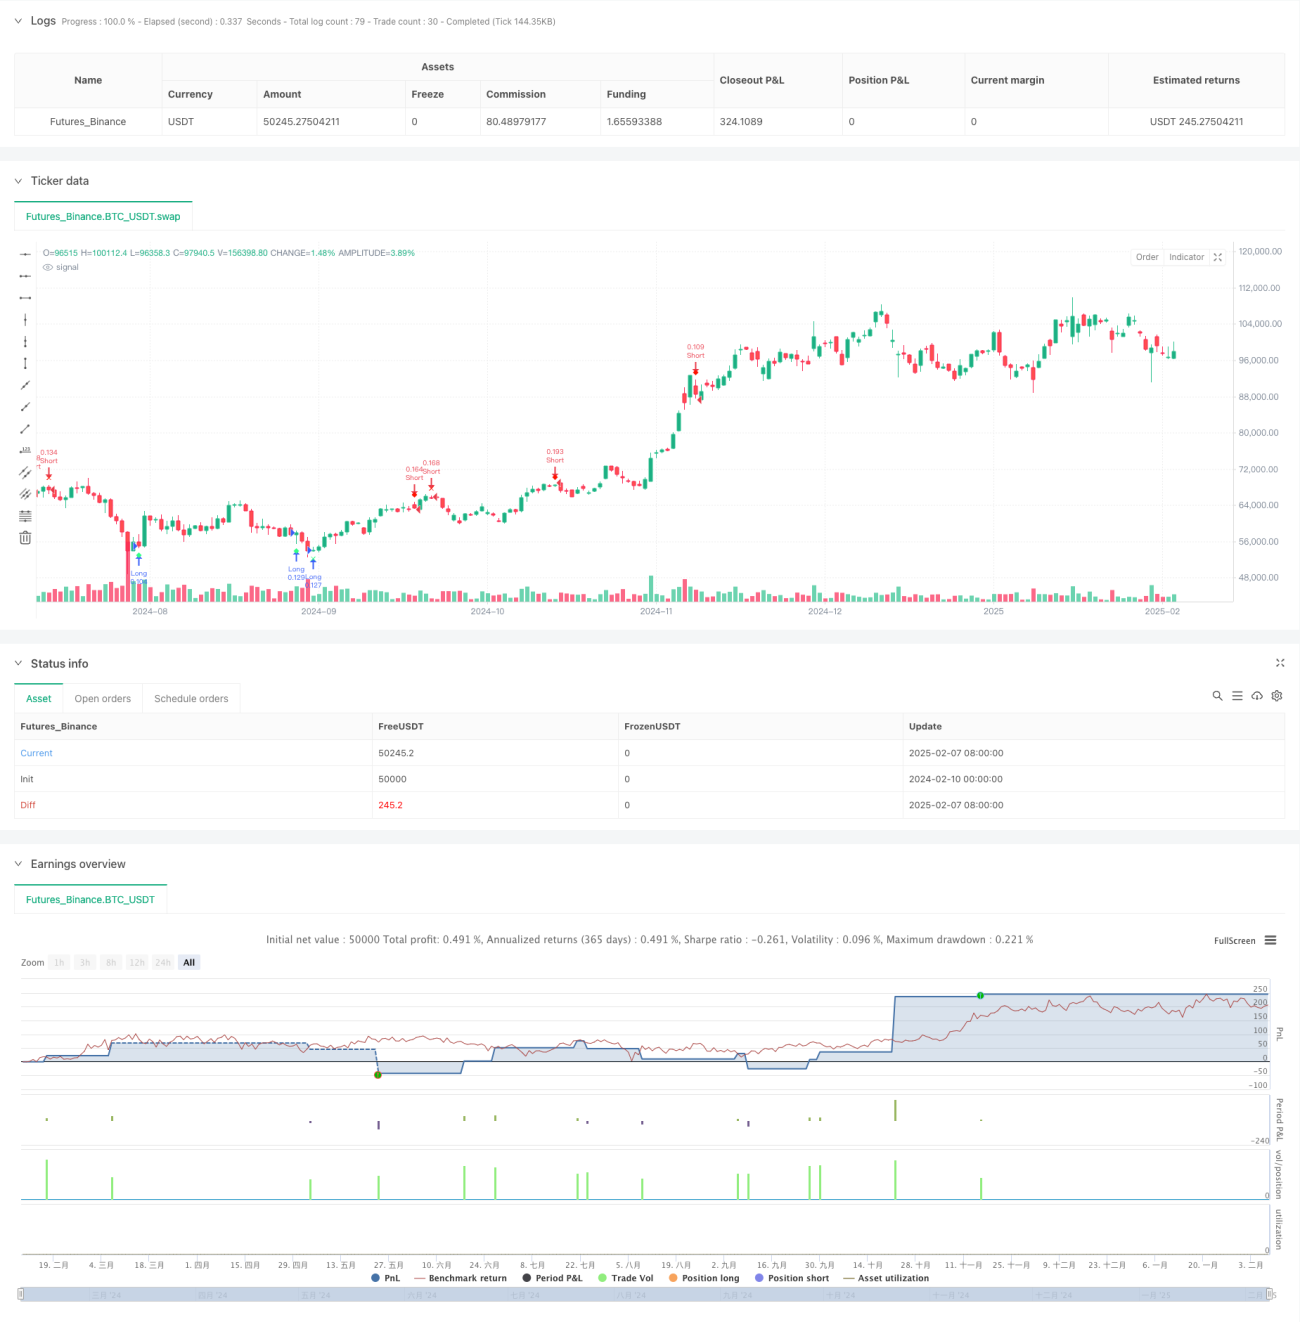
この戦略は,市場疲労分析に基づく多層取引システムであり,価格動向の深層分析によって,市場が転機を起こす可能性のある重要な瞬間を識別します. この戦略は,資金管理,ストップ・ロズ・オプティマイゼーション,撤回制御などの複数の次元を含むダイナミックなリスク管理機構を組み合わせて,完全な取引意思決定の枠組みを形成します.

戦略原則

戦略の核心は,価格の連続的な動きを監視することによって,市場の疲労の程度を判断することです.具体的には:

  1. トレンドの方向は,現在の閉店価格と,以前の4K線の閉店価格を比較することによって決定されます.
  2. 3つの異なる強度レベルの信号のトリガーポイントが設定されている (9/12/14)
  3. 価格が1つの方向に動き続けると,システムはシグナル数を蓄積します.
  4. 既定の信号の強さの値に達すると,システムは対応するレベルの取引信号を与えます.
  5. ATRベースのダイナミック・ストップ・メカニズムとリスク・リターン・比率を統合したポジション管理システム

戦略的優位性

  1. 多層のシグナルシステムにより,異なるレベルの取引機会の識別が可能です.
  2. 資金管理とリスク管理の仕組みによる資金の保護
  3. ATRのダイナミックストップにより,市場の波動に適応できます.
  4. 追跡可能なストップ・ロスの導入により,利潤を確実に確保できます.
  5. 過剰な損失を防ぐために最大撤回保護を設定します.
  6. システムには良好な拡張性とパラメータ最適化スペースがある

戦略リスク

  1. 市場が揺れ動いていると誤った信号が出る可能性
  2. 固定信号の値は,すべての市場環境に適さない可能性があります.
  3. 急速な逆転により,最大損失が予想される.
  4. 複数のパラメータを最適化する必要があります.
  5. 資金管理システムは,特定の状況で利益の余地を制限する可能性があります.

戦略最適化の方向性

  1. 市場波動率のフィルタリングメカニズムを導入し,異なる波動環境でシグナル値を調整する
  2. ボリューム分析の次元を増やし、信号の信頼性を向上
  3. 適応性のあるパラメータ最適化システムを開発
  4. 市場環境分析指標の追加
  5. 資金管理システムの最適化と柔軟性

要約する

この戦略は,多層の疲労分析と完善したリスク管理システムによって,トレーダーに体系化された取引の枠組みを提供します.いくつかの最適化が必要な場所があるにもかかわらず,全体的な設計理念は完ぺきで,実用的な応用価値があります.現場で保守的な資金管理戦略を採用し,パラメータの最適化とシステムの改善を継続することを推奨しています.

ストラテジーソースコード
/*backtest
start: 2024-02-10 00:00:00
end: 2025-02-08 08:00:00
period: 1d
basePeriod: 1d
exchanges: [{"eid":"Futures_Binance","currency":"BTC_USDT"}]
*/

//@version=6
strategy(title="Improved Exhaustion Signal with Risk Management and Drawdown Control", shorttitle="Exhaustion Signal", overlay=true)

// ———————————————— INPUT SETTINGS ————————————————
showLevel1 = input.bool(true, 'Show Level 1 Signals')
showLevel2 = input.bool(true, 'Show Level 2 Signals')
showLevel3 = input.bool(true, 'Show Level 3 Signals')

// Thresholds for signal strength levels
level1 = 9
level2 = 12
level3 = 14

// Risk management inputs
riskPercentage = input.float(1.0, title="Risk Percentage per Trade", minval=0.1, maxval=5.0)  // Risk per trade in percentage
riskRewardRatio = input.float(2.0, title="Risk-to-Reward Ratio", minval=1.0, maxval=5.0)  // Reward-to-risk ratio
trailingStop = input.bool(true, title="Enable Trailing Stop")  // Enable/Disable trailing stop
trailingStopDistance = input.int(50, title="Trailing Stop Distance (in points)", minval=1)  // Distance for trailing stop

// Drawdown protection settings
maxDrawdown = input.float(10.0, title="Max Drawdown Percentage", minval=0.1, maxval=50.0)  // Max allowable drawdown before stopping trading

// ———————————————— GLOBAL VARIABLES ————————————————
var int cycle = 0
var int bullishSignals = 0
var int bearishSignals = 0
var float equityHigh = na  // Initialize as undefined

// Track equity drawdown
if (na(equityHigh) or strategy.equity > equityHigh)
    equityHigh := strategy.equity

drawdownPercent = 100 * (equityHigh - strategy.equity) / equityHigh

// Stop trading if drawdown exceeds the limit
if drawdownPercent >= maxDrawdown
    strategy.close_all()

// ———————————————— FUNCTION: RESET & IMMEDIATE RECHECK USING AN ARRAY RETURN ————————————————
f_resetAndRecheck(_bullish, _bearish, _cycle, _close, _close4) =>
    newBullish = _bullish
    newBearish = _bearish
    newCycle = _cycle

    // Reset cycle if necessary based on price action
    newBullish := 0
    newBearish := 0
    newCycle := 0

    if _close < _close4
        newBullish := 1
        newCycle := newBullish
    else if _close > _close4
        newBearish := 1
        newCycle := newBearish

    resultArray = array.new_int(3, 0)
    array.set(resultArray, 0, newBullish)
    array.set(resultArray, 1, newBearish)
    array.set(resultArray, 2, newCycle)

    resultArray

// ———————————————— EXHAUSTION LOGIC ————————————————
if cycle < 9
    // Bullish cycle: close < close[4]
    if close < close[4]
        bullishSignals += 1
        bearishSignals := 0
        cycle := bullishSignals
    // Bearish cycle: close > close[4]
    else if close > close[4]
        bearishSignals += 1
        bullishSignals := 0
        cycle := bearishSignals
    else
        newVals = f_resetAndRecheck(bullishSignals, bearishSignals, cycle, close, close[4])
        bullishSignals := array.get(newVals, 0)
        bearishSignals := array.get(newVals, 1)
        cycle := array.get(newVals, 2)
else
    // ——— BULLISH checks ———
    if bullishSignals > 0
        if bullishSignals < (level3 - 1)
            if close < close[3]
                bullishSignals += 1
                bearishSignals := 0
                cycle := bullishSignals
            else
                newVals = f_resetAndRecheck(bullishSignals, bearishSignals, cycle, close, close[4])
                bullishSignals := array.get(newVals, 0)
                bearishSignals := array.get(newVals, 1)
                cycle := array.get(newVals, 2)
        else if bullishSignals == (level3 - 1)
            if close < close[2]
                bullishSignals := level3
                cycle := bullishSignals
            else
                newVals = f_resetAndRecheck(bullishSignals, bearishSignals, cycle, close, close[4])
                bullishSignals := array.get(newVals, 0)
                bearishSignals := array.get(newVals, 1)
                cycle := array.get(newVals, 2)
        else
            newVals = f_resetAndRecheck(bullishSignals, bearishSignals, cycle, close, close[4])
            bullishSignals := array.get(newVals, 0)
            bearishSignals := array.get(newVals, 1)
            cycle := array.get(newVals, 2)
    // ——— BEARISH checks ———
    else if bearishSignals > 0
        if bearishSignals < (level3 - 1)
            if close > close[3]
                bearishSignals += 1
                bullishSignals := 0
                cycle := bearishSignals
            else
                newVals = f_resetAndRecheck(bullishSignals, bearishSignals, cycle, close, close[4])
                bullishSignals := array.get(newVals, 0)
                bearishSignals := array.get(newVals, 1)
                cycle := array.get(newVals, 2)
        else if bearishSignals == (level3 - 1)
            if close > close[2]
                bearishSignals := level3
                cycle := bearishSignals
            else
                newVals = f_resetAndRecheck(bullishSignals, bearishSignals, cycle, close, close[4])
                bullishSignals := array.get(newVals, 0)
                bearishSignals := array.get(newVals, 1)
                cycle := array.get(newVals, 2)
        else
            newVals = f_resetAndRecheck(bullishSignals, bearishSignals, cycle, close, close[4])
            bullishSignals := array.get(newVals, 0)
            bearishSignals := array.get(newVals, 1)
            cycle := array.get(newVals, 2)
    else
        newVals = f_resetAndRecheck(bullishSignals, bearishSignals, cycle, close, close[4])
        bullishSignals := array.get(newVals, 0)
        bearishSignals := array.get(newVals, 1)
        cycle := array.get(newVals, 2)

// ———————————————— SIGNAL FLAGS ————————————————
bullishLevel1 = showLevel1 and (bullishSignals == level1)
bearishLevel1 = showLevel1 and (bearishSignals == level1)

bullishLevel2 = showLevel2 and (bullishSignals == level2)
bearishLevel2 = showLevel2 and (bearishSignals == level2)

bullishLevel3 = showLevel3 and (bullishSignals == level3)
bearishLevel3 = showLevel3 and (bearishSignals == level3)

// ———————————————— PLOT SIGNALS ————————————————
plotshape(bullishLevel1, style=shape.diamond, color=color.new(#30ff85, 0), textcolor=color.white, size=size.tiny, location=location.belowbar, title="Level 1 Bullish Signal")
plotshape(bearishLevel1, style=shape.diamond, color=color.new(#ff1200, 0), textcolor=color.white, size=size.tiny, location=location.abovebar, title="Level 1 Bearish Signal")

plotshape(bullishLevel2, style=shape.xcross, color=color.new(#30ff85, 0), textcolor=color.white, size=size.tiny, location=location.belowbar, title="Level 2 Bullish Signal")
plotshape(bearishLevel2, style=shape.xcross, color=color.new(#ff1200, 0), textcolor=color.white, size=size.tiny, location=location.abovebar, title="Level 2 Bearish Signal")

plotshape(bullishLevel3, style=shape.flag, color=color.new(#30ff85, 0), textcolor=color.white, size=size.tiny, location=location.belowbar, title="Level 3 Bullish Signal")
plotshape(bearishLevel3, style=shape.flag, color=color.new(#ff1200, 0), textcolor=color.white, size=size.tiny, location=location.abovebar, title="Level 3 Bearish Signal")

// ———————————————— RESET AFTER LEVEL 3 ————————————————
if bullishSignals == level3 or bearishSignals == level3
    bullishSignals := 0
    bearishSignals := 0
    cycle := 0

// ———————————————— BACKTEST LOGIC ————————————————
// Set up basic long and short entry conditions based on signal levels
longCondition = bullishLevel1 or bullishLevel2 or bullishLevel3
shortCondition = bearishLevel1 or bearishLevel2 or bearishLevel3

// Calculate position size based on risk percentage
equity = strategy.equity
riskAmount = equity * riskPercentage / 100
atr = ta.atr(14)
stopLossLevel = atr * 1.5  // Using ATR for dynamic stop-loss
positionSize = riskAmount / stopLossLevel

// Initialize strategy logic
if longCondition
    strategy.entry("Long", strategy.long, qty=positionSize)

if shortCondition
    strategy.entry("Short", strategy.short, qty=positionSize)

// ———————————————— CONCRETE STOP LOSS AND TAKE PROFIT ————————————————
stopLoss = stopLossLevel
takeProfit = stopLoss * riskRewardRatio

// Apply stop loss and take profit to the strategy based on concrete price levels
strategy.exit("Exit Long", from_entry="Long", stop=close - stopLoss, limit=close + takeProfit)
strategy.exit("Exit Short", from_entry="Short", stop=close + stopLoss, limit=close - takeProfit)

// ———————————————— TRAILING STOP ————————————————
if trailingStop
    strategy.exit("Exit Long Trailing", from_entry="Long", trail_price=close - trailingStopDistance, trail_offset=trailingStopDistance)
    strategy.exit("Exit Short Trailing", from_entry="Short", trail_price=close + trailingStopDistance, trail_offset=trailingStopDistance)