SuperTrend に基づくマルチインジケータートレンドモメンタム取引戦略

1
Follow
1781
Followers
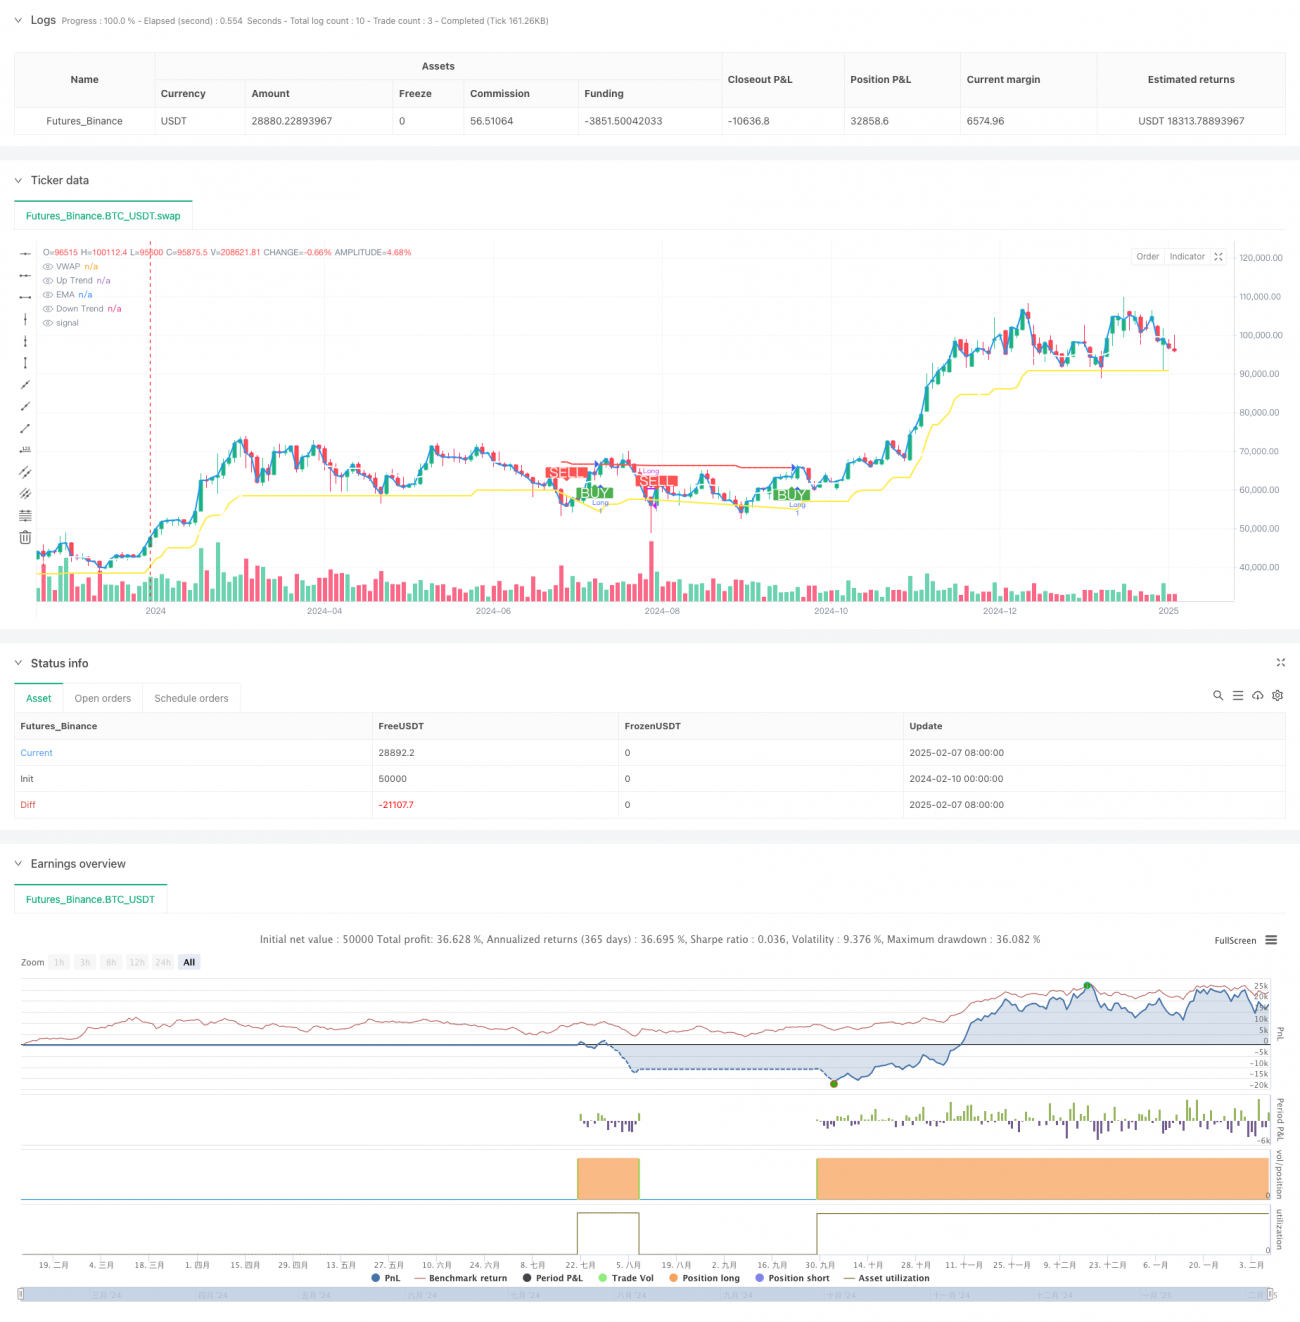
概要
これは,SuperTrend,VWAP,EMA,およびADXの複数の技術指標を組み合わせたトレンド追跡取引戦略である.この戦略は,主にSuperTrend指標によってトレンドの方向性を認識し,VWAPとEMAの位置関係を利用してトレンドを確認し,ADX指標を使用して弱いトレンドをフィルタリングし,高精度な取引信号を提供する.この戦略は,特に5分,15分および1時間の周期で,日内取引に適しています.
戦略原則
戦略の核心的な論理は,以下の重要な要素に基づいています.
- スーパートレンド指数は,10サイクルATRと3.0の倍数を使用して計算され,トレンドの方向を決定します.価格が上線を突破すると多頭トレンドが形成され (緑),下線を突破すると空頭トレンドが形成されます (赤).
- 21周期EMAは,動的サポート/レジスタンス位として使用され,VWAPとトレンドを共同確認する.VWAPがEMAの上に位置するときは,多頭偏りを持つ;逆に空頭偏りを持つ.
- ADX指数は,トレンドの強さを測定するために使用され,ADX数値が25以上になるとトレンドが強く,取引シグナルが信頼される.25未満になるとトレンドが弱い,注意が必要です.
- 入場条件は以下の通りです.
買い信号:スーパートレンドが緑に変化し (上昇傾向が確認された),閉盤価格はVWAPとEMAの上で,ADXはトレンドの強さを示した.
販売シグナル:スーパートレンドが赤色に変化した (下落傾向が確認された),VWAPとEMAの下での閉盘価格,ADXが下落傾向の強さを確認した.
戦略的優位性
- マルチメーターのクロス検証により,取引シグナルの正確性が向上し,偽突破を効果的に減らす.
- ADX指数で弱気なトレンドをフィルタリングすることで,取引成功率を向上させました.
- 戦略は,取引の実行を容易にするために,明確な買付信号を提供し,トレンドの背景の色を表示します.
- パラメータは,異なる市場と取引品種に応じて柔軟に調整され,適応性が強い.
- トレンドフォローと動量取引の優位性を組み合わせて,強いトレンドの状況でよりよい収益を得ることができます.
戦略リスク
- 波動的な市場では,誤信号が頻繁に発生し,連続的な損失を招く可能性があります.
- 複数の指標を使用すると,信号の遅延が起こり,入場時刻に影響を与える可能性があります.
- ATRパラメータの設定は,戦略のパフォーマンスに大きな影響を与える.不適切なパラメータは,過度のフィードバックまたは信号不足を引き起こす可能性があります.
- 急速な逆転の状況では,戦略的反応が十分には及ばず,後退を招く可能性があります.
戦略最適化の方向性
- 取引量指標を導入し,取引量によって価格突破の有効性を確認することができる.
- 資金管理能力の向上のために,ストップ・ローズ・ストップ機能を追加することを検討する.
- 市場変動に応じてATRとADXのパラメータを自動的に調整する自己適応パラメータメカニズムを開発する.
- 市場環境の認識機能を追加し,波動的な市場では自動的にポジションを減額または取引を一時停止する.
- より多くの市場構造分析ツール,例えば,サポートレジスタンス,トレンドラインなどの導入により,取引の精度が向上する.
要約する
これは,構造が整った,論理が明確なトレンド追跡戦略である.複数の指標の配合による使用により,取引信号の信頼性が効果的に向上する.戦略の優点は,信号が明確で,実行が容易であり,優れた拡張性があることである.しかし,実用的なアプリケーションでは,市場環境の選択に注意し,リスク管理を行う必要がある.継続的な最適化と改善により,この戦略は,傾向が強い市場において安定した収益を期待する.
Source
Pine
Strategy parameters
Related strategies
Comment
All comments (0)
No data
- 1