
1
Follow
1781
Followers
概要
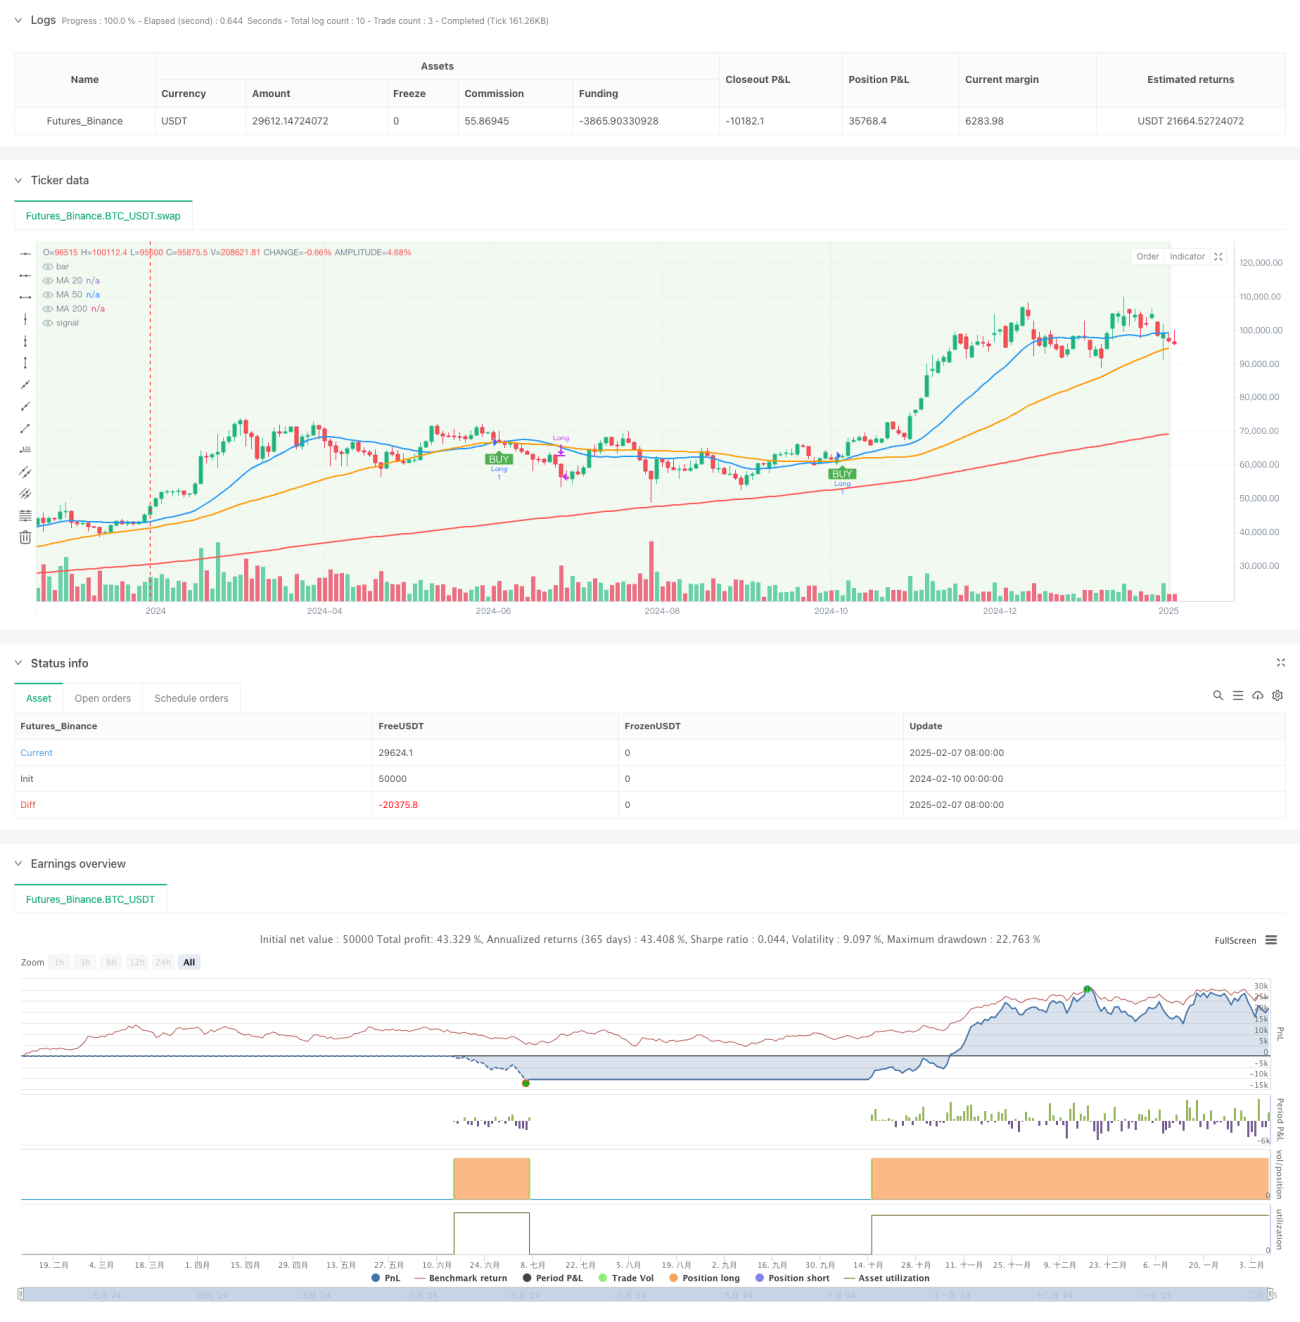
これは,オリバー・ヴァレズの取引方法論に基づいた三重平均線トレンド追跡戦略である.この戦略は,20周期,50周期,および200周期の移動平均の交差信号を使用して,市場トレンドと取引機会を識別する.200周期平均線は,主要なトレンドフィルターとして使用され,20周期および50周期平均線の交差は,特定の取引信号を生成するために使用されます.この戦略は,リスク管理機能を内蔵しています.
戦略原則
戦略の核心的な論理には,以下の3つの重要な側面があります.
- トレンド識別: 200周期平均線をトレンドの境界線として使用する. 200平均線上にある時,上昇傾向とみなされ, 200平均線以下にある時,下降傾向とみなされる.
- トレードシグナル:上昇傾向では,20周期平均線が50周期平均線を上方に渡るときに多信号を触発する.下降傾向では,20周期平均線が50周期平均線を下方に渡るときに空信号を触発する.
- リスクコントロール:戦略は,2%のストップと4%のストップをデフォルトで設定し,反転クロスシグナルが発生したときに自動的にポジションをクリアする.
戦略的優位性
- 多重確認メカニズム: 三つの均一線の組み合わせにより,より信頼性の高い取引シグナルを提供します.
- トレンドフィルター:200の均等なトレンドフィルタ機能は,偽突破のリスクを効果的に低減する.
- 柔軟性:SMAとEMAの間の切り替えをサポートし,異なる市場の特徴に応じてパラメータを調整できます.
- リスク管理の改善: 資産の安全を守るための内蔵の止損防止システム
- 視覚効果:背景の色を直感的に変化させることでトレンドの状態を表示する.
戦略リスク
- 遅滞性:移動平均は本質的に遅滞の指標であり,入場や出場のタイミングをわずかに遅らせることがある.
- 振動市場には適用されない:横盤整理段階では,頻繁に均線交差が偽信号を生じることがあります.
- 固定ストップリスク: 固定パーセンテージストップを使用することは,すべての市場環境に適していない可能性があります.
- パラメータの感度:異なる均線周期設定は,著しく異なる結果を生成する可能性があります.
戦略最適化の方向性
- 交差量分析の導入:交差量確認指標を追加して,信号の信頼性を高めることができる.
- ダイナミックストップレード設定:ATRまたは波動率指標を使用してストップレード位置を動的に調整することを検討する.
- トレンド強度フィルターを追加する: 弱気なトレンド環境をフィルタリングする,ADXなどのトレンド強度指標を導入することができます.
- 入場タイミングの最適化: 価格形状とサポートレジスタンス位置を組み合わせて,入場精度を向上させる.
- タイムフィルターを追加:取引時間ウィンドウを設定して,波動性の高い時間を回避できます.
要約する
これは,構造が整った,論理がはっきりしたトレンド追跡戦略である. 三重均等線の協調的な配合により,トレンド識別の正確性が保証され,明確な取引信号が提供される. 戦略のリスク管理機構は比較的完備しているが,まだ最適化の余地がある. 交易者は,実用化する前に十分なフィードバックをテストし,特定の取引品種の特性に応じてパラメータ設定を調整することをお勧めする.
Source
Pine
Strategy parameters
Related strategies
Comment
All comments (0)
No data
- 1