二重移動平均クロスオーバーとストキャスティクスRSI買われすぎと売られすぎの範囲最適化取引戦略

1
Follow
1781
Followers
概要
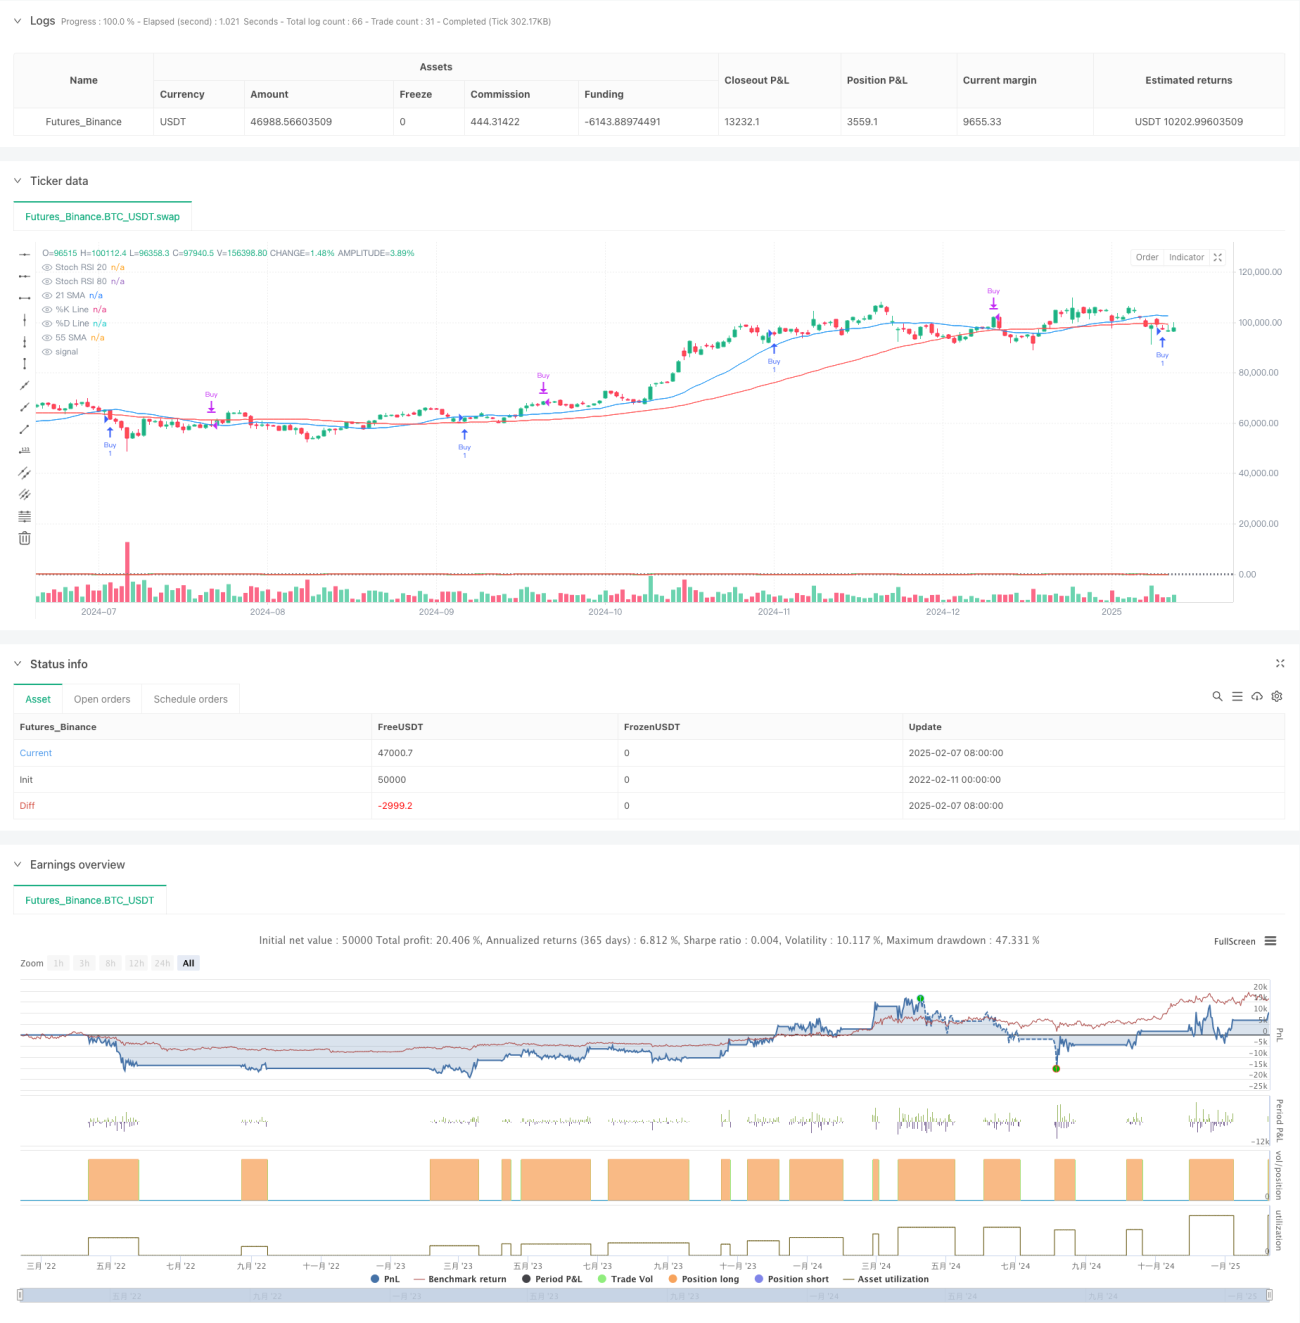
この戦略は,双均線とランダムなRSI指標を組み合わせたトレンド追跡取引システムである.21周期と55周期の単純な移動平均によって市場のトレンドを判断し,ランダムなRSIのオーバーバイオーバーセール区間を探し,最適のエントリーポイントとエクジットポイントを見つけ,トレンド取引の最適化を実現する.戦略は,上昇トレンドを確認した上で,オーバーセール区域で買入の機会を探し,オーバーセール区域で売出の機会を探している.
戦略原則
戦略の核心となる論理は次のとおりです.
- トレンド確認:21周期SMAと55周期SMAを用いて,短期平均線が長期平均線上にあるとき,上昇傾向を確認する.
- 入場シグナル:トレンドが確認された後,ランダムなRSIのK線が20未満の超売り領域とD線で金色の交差点を形成するのを待つ.
- 出場シグナル:ランダムなRSIのK線が80以上の超買い領域とD線でデッドクロスを形成すると,平仓出場する.
- 信号フィルタリング:トレンドと動力の指標を組み合わせて,偽信号を効果的に減らす.
戦略的優位性
- 多重確認メカニズム:トレンドと動力の二重確認により取引の信頼性を高めます.
- リスクコントロールの最適化: 超買超売の区間を利用して,トレンドの方向に優越した入場点を選択する.
- 柔軟性:戦略のパラメータは,異なる市場の特徴に応じて調整することができます.
- 信号は明快で,入場・出場条件は明確で,実行しやすい.
- 体系化度が高い: 戦略の論理は完全に体系化され,主観的な判断は減少している.
戦略リスク
- 横軸の振動市場では,頻繁に取引が起こりうる.
- 遅滞リスク:移動平均は遅滞性があり,入場の最適なタイミングを逃す可能性があります.
- 偽の突破リスク:ランダムなRSIは,波動的な市場において偽のシグナルを生む可能性があります.
- パラメータの感度: パラメータの組み合わせが異なると、戦略のパフォーマンスに大きな違いが生じる可能性があります。
戦略最適化の方向性
- 波動率のフィルタを追加:ATR指標を導入し,低波動率の期間に取引頻度を減らす.
- 出場メカニズムの最適化:移動のストップ損失または利益目標の追加を検討できます.
- 市場環境の分類:異なる市場環境の動態に応じてパラメータの調整
- 取引量確認:取引量指標の有効性を検証する信号を追加する.
- トレンド強度指標の導入:ADXのような,弱いトレンド環境をフィルタリングするために.
要約する
この戦略は,古典的な技術指標を組み合わせて,完全なトレンド追跡取引システムを構築している. 戦略は,シンプルで直感的なままながら,複数のシグナル確認によって信頼性が向上している. 合理的なパラメータの最適化とリスク管理によって,この戦略は,良い実用価値を持っている. 交易者は,実用化する前に十分なフィードバックを行い,特定の市場の特徴に応じてパラメータを調整することをお勧めする.
Source
Pine
Strategy parameters
Related strategies
Comment
All comments (0)
No data
- 1