二重指数平滑法トレンドフォロー取引システム

EMA ATR RSI AI ML
作成日: 2025-02-10 14:46:36 最終変更日: 2025-02-10 14:46:36
コピー: 1 クリック数: 335
1
フォロー
1617
フォロワー

二重指数平滑法トレンドフォロー取引システム

概要

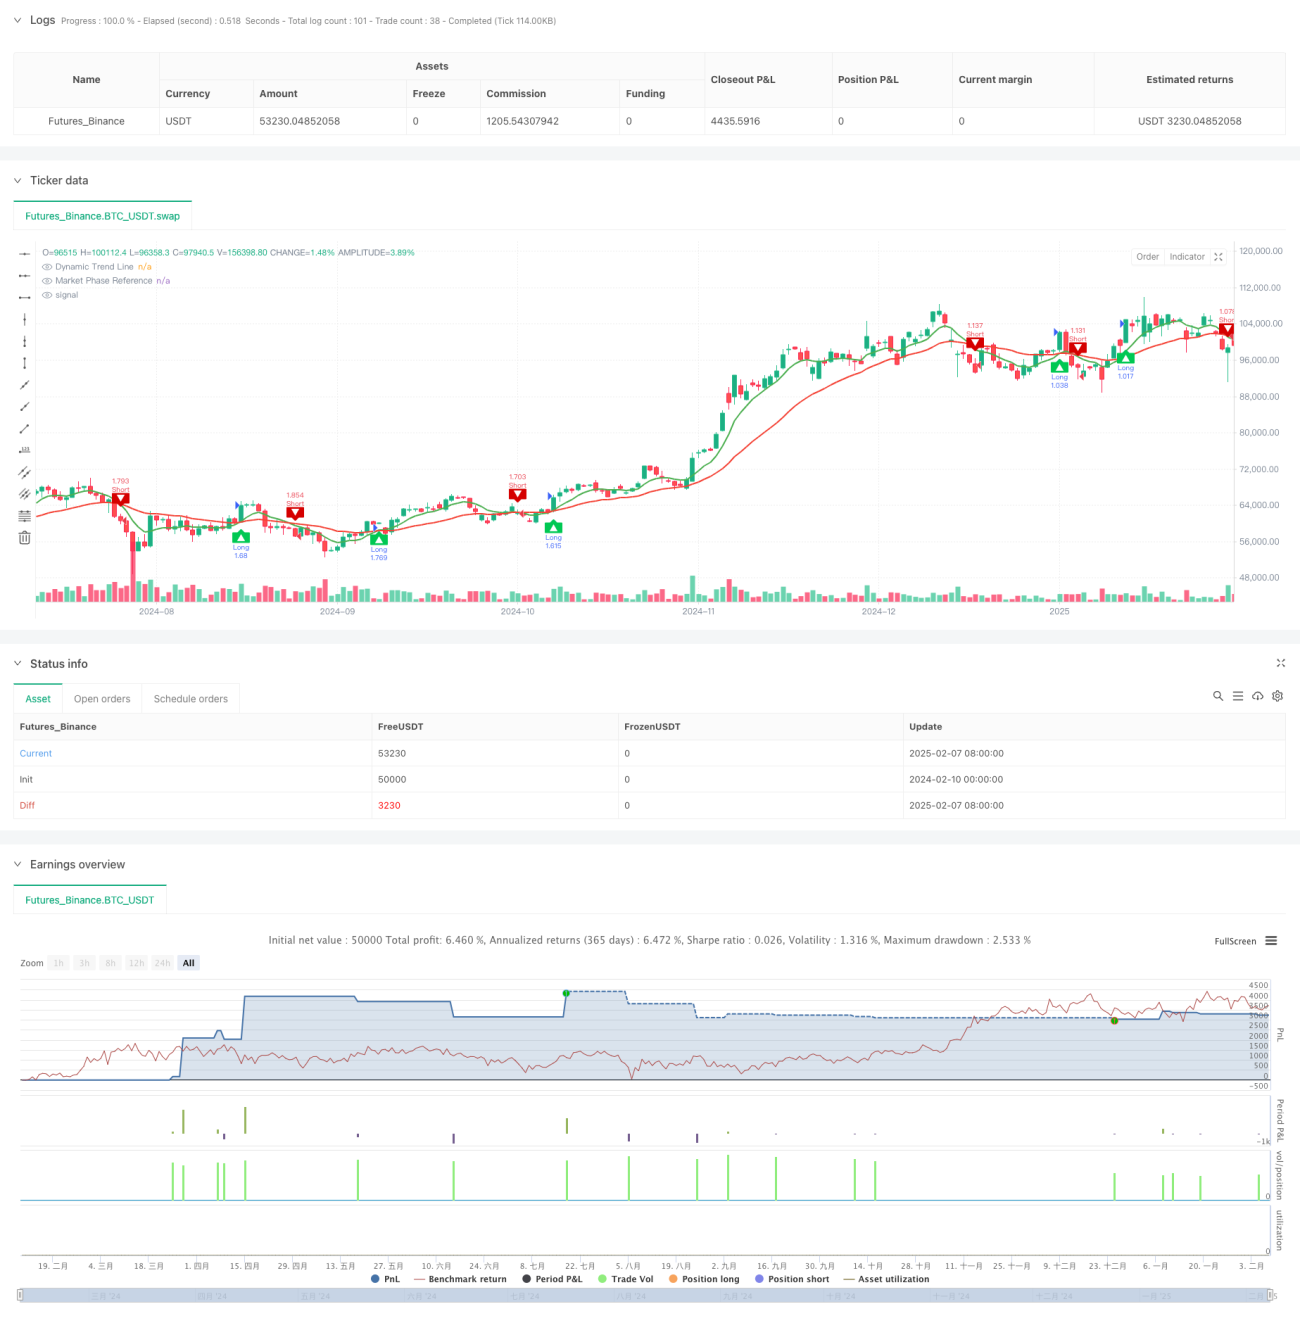
この戦略は,市場動向を識別するために二重インデックス平滑技術を使用した革新的なトレンド追跡取引システムである.このシステムは,価格データの特殊なインデックス平滑処理によって,市場の短期的および長期的動きを捉えるために2つのトレンドラインを生成する.このシステムは,ストップ・ストップ・損失設定を含む完全なリスク管理モジュールと,柔軟なポジション管理機能を統合している.

戦略原則

戦略の核心は,その独特の二重指数平行アルゴリズムである. まず,システムは,終了価格を重み付けで処理し,計算方法として ((最高価格+最低価格+2*市場騒音の影響を軽減する.その後,カスタマイズされた指数平滑関数を使用して,9周期と30周期の平滑曲線を計算する.短期曲線が長期曲線を横切ると,システムは取引信号を生成する.上穿は多信号を生成し,下穿は空信号を生成する.システムには,パーセントベースのポジション管理システムが含まれ,口座の100%の資金をデフォルトで取引する.

戦略的優位性

  1. シグナル生成の仕組みは明快で,伝統的なトレンドフォッキングの理念を採用し,理解し,実行しやすい.
  2. 双層指数平滑技術により,市場のノイズを効果的にフィルターし,信号の質を向上させる.
  3. ストップ・ストップ・損失とポジション管理を含む完全なリスク管理システムが統合されています.
  4. システムは,異なる市場環境に自律的に適応し,複数の取引品種に適用されます.
  5. 市場がどの方向に進むかを判断するための 明確な視覚的な指示器が提供されています.

戦略リスク

  1. 波動的な市場では,頻繁に偽信号が生じ,連続したストップダメージを引き起こす可能性があります.
  2. 100%の資金で取引するデフォルトで,高すぎるレバレッジは大きなリスクをもたらす可能性があります.
  3. 固定ポイントのストップ・ストラスト設定は,すべての市場環境に適していない可能性があります.
  4. 市場が激しく波動しているときに,システムに滑り込み,執行の効果に影響を与える可能性があります.
  5. 過去のテストの結果は,将来のパフォーマンスを保証するものではありません.

戦略最適化の方向性

  1. 波動率指標 ((ATRなど) を導入して,ストップ・ストップ・ストラスト・ポイントを動的に調整する.
  2. トレンド強度フィルターを追加し,トレンドの弱さの環境で取引頻度を低下させる.
  3. 市場環境認識モジュールを追加し,波動的な市場において戦略パラメータを自動的に調整する.
  4. 市場状況に応じて取引規模を自動的に調整するダイナミックなポジション管理システムを開発する.
  5. 基本的分析モジュールを統合し,取引決定の正確性を向上させる.

要約する

これは,合理的で論理的に明確なトレンド追跡システムである. 二重インデックス・スムージング技術と完全なリスク管理システムにより,この戦略はトレンド市場で良好なパフォーマンスを発揮できる. しかし,ユーザーは,自身のリスク承受能力に応じてポジションサイズを調整する必要がある.

ストラテジーソースコード
/*backtest
start: 2024-02-10 00:00:00
end: 2025-02-08 08:00:00
period: 1d
basePeriod: 1d
exchanges: [{"eid":"Futures_Binance","currency":"BTC_USDT"}]
*/

//@version=5  
strategy("Dynamic Trend Navigator AI [CodingView]", overlay=true, initial_capital=100000, default_qty_type=strategy.percent_of_equity , default_qty_value=200 )  


// ==================================================================================================  
// This source code is subject to the terms of the Mozilla Public License 2.0 at https://mozilla.org/MPL/2.0/  
// © CodingView_23
//  
// Script Name: Dynamic Trend Navigator  
// Developed by: theCodingView Team  
// Contact: [email protected]  
// Website: www.theCodingView.com  
//  
// Description: Implements an adaptive trend-following strategy using proprietary smoothing algorithms.  
// Features include:  
// - Dual timeframe trend analysis  
// - Custom exponential smoothing technique  
// - Integrated risk management (profit targets & stop-loss)  
// - Visual trend direction indicators  
// ==================================================================================================  


// ====== Enhanced Input Configuration ======  
primaryLookbackWindow = input.int(9, "Primary Trend Window", minval=2)  
secondaryLookbackWindow = input.int(30, "Secondary Trend Window", minval=5)  

// ====== Custom Exponential Smoothing Implementation ======  
customSmoothingFactor(periods) =>  
    smoothingWeight = 2.0 / (periods + 1)  
    smoothingWeight  

adaptivePricePosition(priceSource, lookback) =>  
    weightedSum = 0.0  
    smoothingCoefficient = customSmoothingFactor(lookback)  
    cumulativeWeight = 0.0  
    for iteration = 0 to lookback - 1 by 1  
        historicalWeight = math.pow(1 - smoothingCoefficient, iteration)  
        weightedSum := weightedSum + priceSource[iteration] * historicalWeight  
        cumulativeWeight := cumulativeWeight + historicalWeight  
    weightedSum / cumulativeWeight  

// ====== Price Transformation Pipeline ======  
modifiedClose = (high + low + close * 2) / 4  
smoothedSeries1 = adaptivePricePosition(modifiedClose, primaryLookbackWindow)  
smoothedSeries2 = adaptivePricePosition(modifiedClose, secondaryLookbackWindow)  

// ====== Signal Detection System ======  
trendDirectionUp = smoothedSeries1 > smoothedSeries2 and smoothedSeries1[1] <= smoothedSeries2[1]  
trendDirectionDown = smoothedSeries1 < smoothedSeries2 and smoothedSeries1[1] >= smoothedSeries2[1]  

// ====== Visual Representation Module ======  
plot(smoothedSeries1, "Dynamic Trend Line", #4CAF50, 2)  
plot(smoothedSeries2, "Market Phase Reference", #F44336, 2)  

// ====== Risk Management Configuration ======  
enableRiskParameters = input.bool(true, "Activate Risk Controls")  
profitTargetUnits = input.float(30, "Profit Target Points")  
lossLimitUnits = input.float(30, "Stop-Loss Points")  

// ====== Position Management Logic ======  
var float entryPrice = na  
var float profitTarget = na  
var float stopLoss = na  

// ====== Long Position Logic ======  
if trendDirectionUp  
    strategy.close("Short", comment="Short Close")  
    strategy.entry("Long", strategy.long)  
    entryPrice := close  
    profitTarget := close + profitTargetUnits  
    stopLoss := close - lossLimitUnits  

if enableRiskParameters  
    strategy.exit("Long Exit", "Long", limit=profitTarget, stop=stopLoss)  

// ====== Short Position Logic ======  
if trendDirectionDown  
    strategy.close("Long", comment="Long Close")  
    strategy.entry("Short", strategy.short)  
    entryPrice := close  
    profitTarget := close - profitTargetUnits  
    stopLoss := close + lossLimitUnits  

if enableRiskParameters  
    strategy.exit("Short Exit", "Short", limit=profitTarget, stop=stopLoss)  

// ====== Visual Signals ======  
plotshape(trendDirectionUp, "Bullish", shape.labelup, location.belowbar, #00C853, text="▲", textcolor=color.white)  
plotshape(trendDirectionDown, "Bearish", shape.labeldown, location.abovebar, #D50000, text="▼", textcolor=color.white)  

// ====== Branding Module ======  
var brandingTable = table.new(position.bottom_right, 1, 1)  
if barstate.islast  
    table.cell(brandingTable, 0, 0, "Trading System v2.0", text_color=color.new(#607D8B, 50))