
1
Follow
1781
Followers
概要
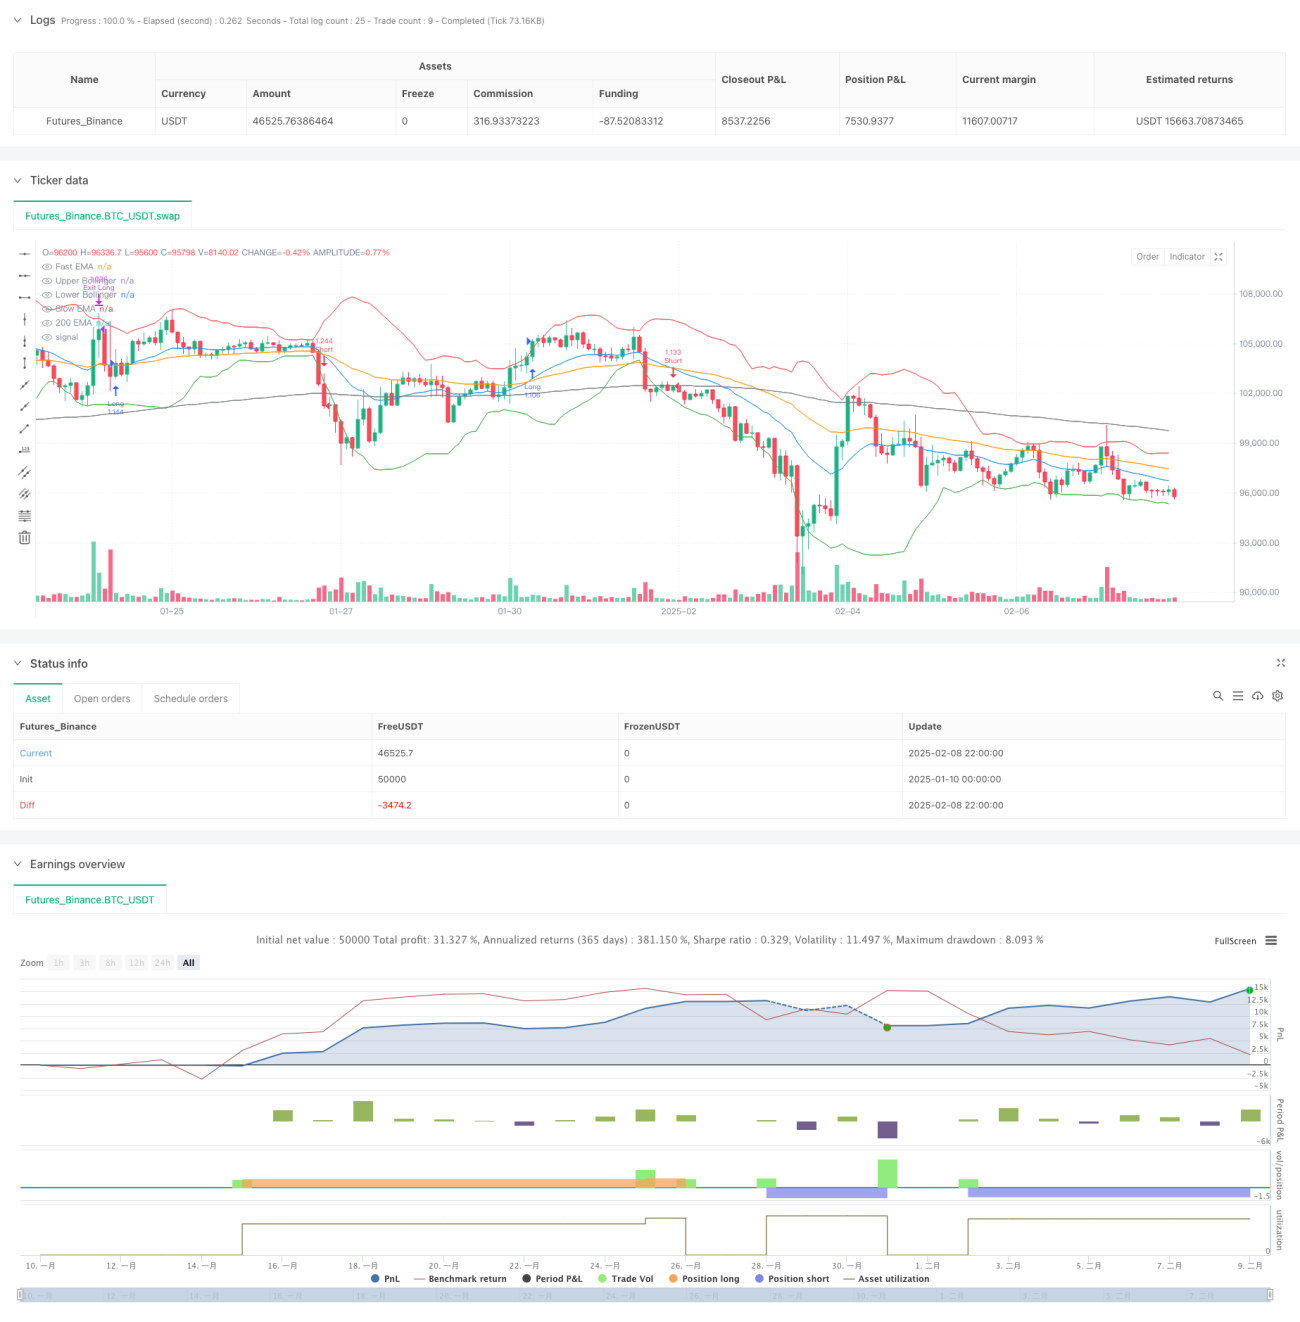
この戦略は,複数の技術指標を組み合わせたトレンド追跡システムであり,移動平均 ((EMA),相対的に強い指標 ((RSI),移動平均相似分散指標 ((MACD) とブリン帯 ((BB) などを統合することで,完全な取引意思決定の枠組みを構築しています. この戦略は, リスク調整後の安定した利益を達成するために, リスク管理の方法, リスク収益の比率に基づくストップとリスク収益に基づくストップセットを含むダイナミックなリスク管理方法を採用しています.
戦略原則
戦略の核心的な論理は,多層の市場分析に基づいています.
- トレンド確認: 200日間のEMAを使用して長期トレンドの方向を決定し,急速EMA ((20日) と遅いEMA ((50日) の交差確認の中期トレンドの変化
- 動力の検証:RSI指標とMACDを用いて市場の動力を二重検証し,RSIが50以上 (多頭) または50以下 (空頭) にあることを要求し,MACD信号線が対応する方向を支える
- 波動性制御:ブリン帯を介して取引の正確なタイミングを把握し,下線サポート位で多額の機会を探し,上線抵抗位で空白の機会を探し
- リスク管理: 2%のストップ・ロスの設定と1.5倍のリスク・リターンのストップ・レベルを使用して,取引毎のリスクをコントロールできるようにします.
戦略的優位性
- 多次元分析:トレンド,動力,波動の指標を組み合わせて,偽信号の影響を軽減する
- リスク管理が整った: 預設のストップ・ロズとストップ・ストップのレベルは,取引のリスクを制御できるようにします.
- 適応性: 戦略のパラメータは,異なる市場環境に応じて調整できます.
- 明確で実行可能: 入国・出国条件が明確で,実行・監視が容易である
- 資金管理の合理性:口座権益比率を用いてポジションコントロールを行い,過度のリスクを避ける
戦略リスク
- 市場変動リスク:高波動期に頻繁にストップを起こす可能性
- トレンド・リバース・リスク: トレンド・リバース・ポイントで大きなリターンが発生する可能性がある
- パラメータ最適化のリスク: 過剰な最適化は過剰適合につながる可能性がある
- 実行滑り場リスク:流動性の不足で大きな滑り場に直面する可能性がある
- コミッションコストのリスク: 頻繁に取引すると取引コストが高くなる
戦略最適化の方向性
- 動的パラメータ調整:市場の変動率に応じて指標パラメータを自動的に調整できる
- 市場情緒指標の増強:取引量などの指標の導入により,信号の信頼性が向上
- ストップ・ロスを最適化:ストップ・ロスを追跡し,利益保護能力を向上させる
- タイムフィルター導入:取引時間ウィンドウの追加フィルタリング
- 波動率のフィルターを追加: 波動性の過多な時期にポジションを下げたり,取引を一時停止したり
要約する
この戦略は,複数の技術指標を総合的に適用することで,トレンド追跡取引システムの完全な構造を確立している.厳格なリスク管理と多次元的な市場分析により,戦略は優れた適応性と安定性を有している.ある程度の最適化の余地があるものの,全体的な枠組みは合理的に設計され,中長期の取引戦略の基礎として適している.戦略の成功実施には,継続的な監視と,異なる市場環境に対応するために適切なパラメータの調整が必要である.
Source
Pine
/*backtest
start: 2025-01-10 00:00:00
end: 2025-02-09 00:00:00
period: 2h
basePeriod: 2h
exchanges: [{"eid":"Futures_Binance","currency":"BTC_USDT"}]
*/

//@version=5
strategy("Altcoin Long/Short Strategy", overlay=true, initial_capital=1000, default_qty_type=strategy.percent_of_equity, default_qty_value=200, commission_type=strategy.commission.percent, commission_value=0.1)

// —————— Inputs ——————Strategy parameters
Related strategies
Comment
All comments (0)
No data
- 1