複数の指標のトレンドフォローとモメンタムを組み合わせた高度な定量取引戦略

VWAP EMA RSI ATR MACD ADX PSAR BB
作成日: 2025-02-10 15:13:07 最終変更日: 2025-02-10 15:13:07
コピー: 0 クリック数: 500
1
フォロー
1617
フォロワー

複数の指標のトレンドフォローとモメンタムを組み合わせた高度な定量取引戦略

概要

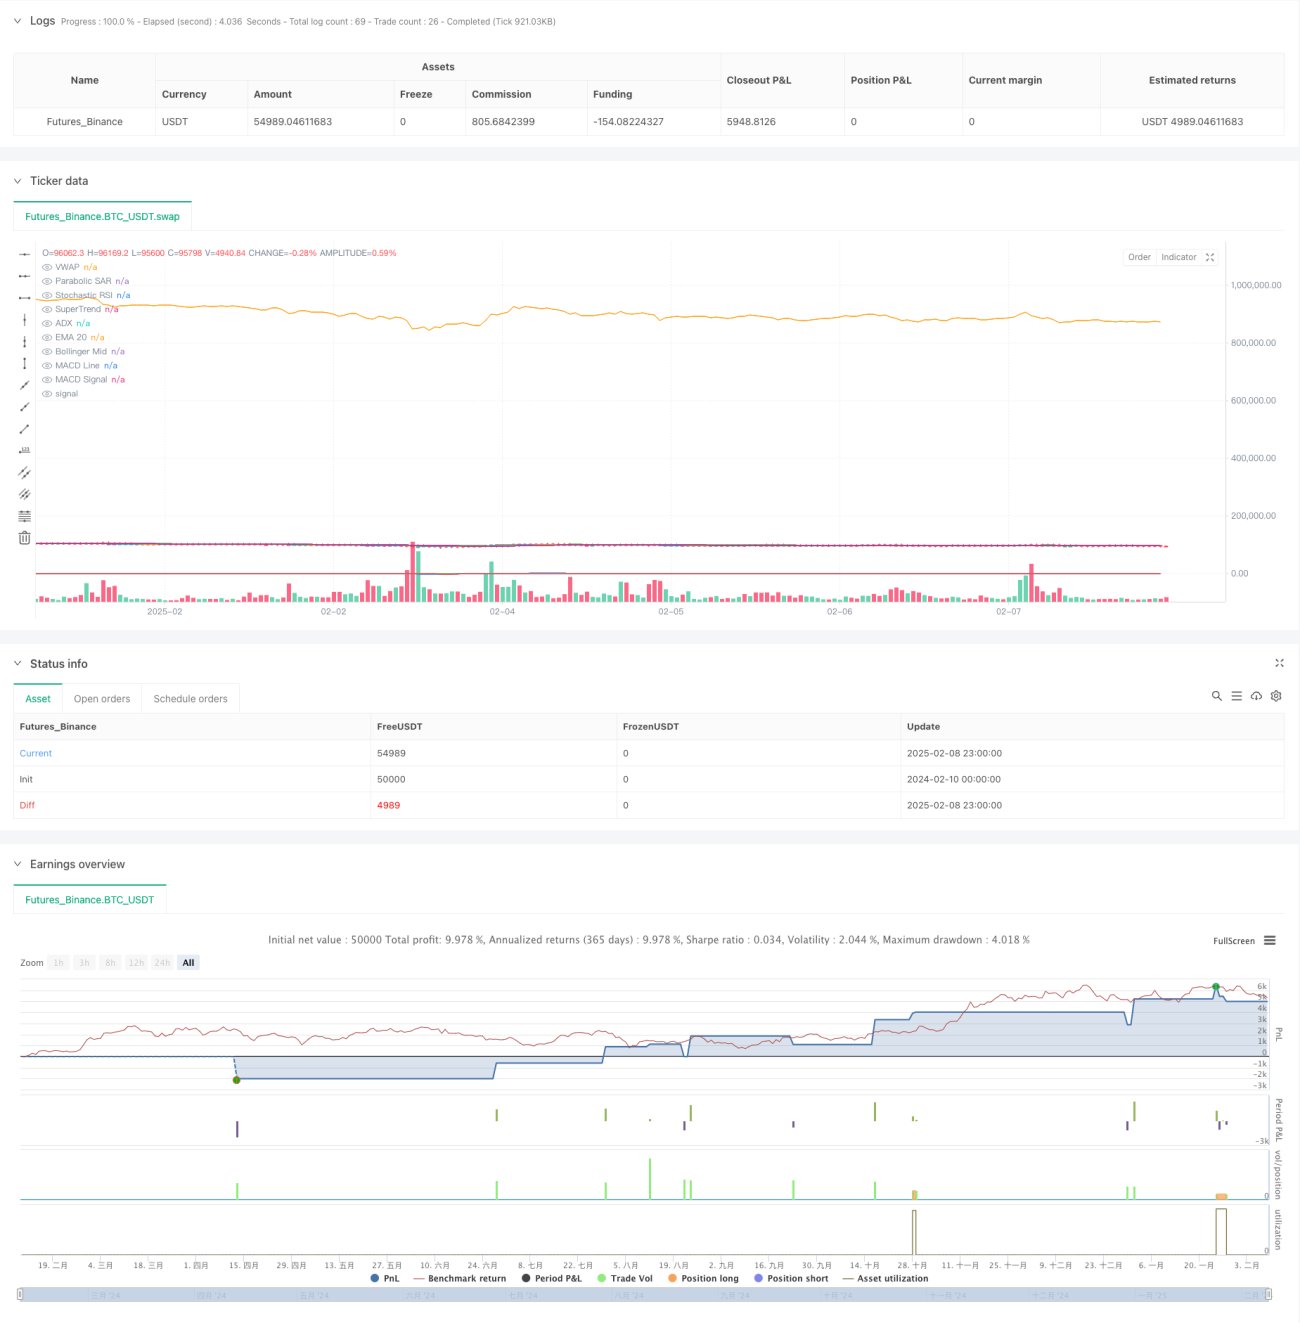
この戦略は,複数の技術指標を組み合わせた複雑な量化取引システムであり,トレンドフォローと動力の分析を組み合わせて取引する.この戦略は,取引量重み平均価格 (VWAP),インデックス移動平均 (EMA),相対的に強い指標 (RSI) などの複数の指標を統合して,包括的な取引意思決定の枠組みを構築する.この戦略は,市場動向の確認と動力の持続性に重点を置く.

戦略原則

戦略は,取引信号を確認するために多層のフィルタリングメカニズムを使用します.価格がVWAPとEMA20の上にあり,SuperTrend指標が上昇傾向を示しているときに,システムはより多くの機会を探し始めます.同時に,RSI指標と組み合わせて動力の確認を行い,ブリンを使用して波動的な拡大を識別します.戦略は,トレンドの持続性を確認するためにMACD指標を統合し,トレンドの強さを測定するためにADXを使用します.

戦略的優位性

  1. 多次元分析:複数の技術指標を統合することで,より包括的な市場見通しを提供
  2. リスク管理の改善:ATRを使ってストップポジションを動的に調整し,市場の波動に適応する
  3. トレンド確認の信頼性: マルチ指標のクロス検証により,偽突破が大幅に減少
  4. 適応性: ストップ・ローズと利益目標が市場の変動に合わせて自動的に調整される
  5. 厳格な戦略論理:入場条件が複数のフィルタリングを経て,誤信号の確率を低減する

戦略リスク

  1. 信号の遅延: 複数の認証メカニズムにより,入場時間が少し遅れる可能性があります.
  2. 振動市場の不振:横軸振動市場の誤信号が頻繁に発生する可能性がある
  3. パラメータ最適化のリスク:指標が多すぎると過度に最適化される
  4. 実行コストが高い: 頻繁に取引すると取引コストが高くなる
  5. 市場環境依存:戦略は市場サイクルによって大きく異なる

戦略最適化の方向性

  1. 波動性フィルターの導入:低波動性の環境で取引頻度を低下させる
  2. 指標の重みを最適化:異なる市場環境における各指標の重要性に動的に調整する
  3. 交差量分析:交差量変化を組み合わせて信号信頼性を強化する
  4. スマートストップ開発:市場の構造動向に応じてストップポジションの調整
  5. タイムフィルター:特定の時間帯での入学条件の強化

要約する

この戦略は,複数の技術指標を総合的に適用することで,比較的完善な取引システムを構築した.一定の遅れやパラメータ最適化リスクがあるにもかかわらず,厳格なリスク制御と複数の信号確認により,戦略は良好な安定性と適応性を示した.継続的な最適化と改善により,この戦略は,異なる市場環境で安定したパフォーマンスを維持することが期待されている.

ストラテジーソースコード
/*backtest
start: 2024-02-10 00:00:00
end: 2025-02-09 00:00:00
period: 1h
basePeriod: 1h
exchanges: [{"eid":"Futures_Binance","currency":"BTC_USDT"}]
*/

//@version=5
strategy("Nifty 1-Min Advanced Scalping", overlay=true, default_qty_type=strategy.percent_of_equity, default_qty_value=200)

// Indicators
vwap = ta.vwap(close)
ema20 = ta.ema(close, 20)
supertrendFactor = 2
supertrendLength = 10
[superTrend, superTrendDirection] = ta.supertrend(supertrendFactor, supertrendLength)
atr = ta.atr(14)
psar = ta.sar(0.02, 0.2, 0.2)
rsi = ta.rsi(close, 14)
[bbMid, bbUpper, bbLower] = ta.bb(close, 20, 2)
[macdLine, macdSignal, _] = ta.macd(close, 12, 26, 9)
[adx, _, _] = ta.dmi(14, 14)
stochRsi = ta.stoch(close, 14, 3, 3)

// Buy Condition
buyCondition = close > vwap and close > ema20 and superTrendDirection == 1 and rsi > 50 and close > bbMid and close > psar and macdLine > macdSignal and adx > 25 and stochRsi > 20

// Sell Condition
sellCondition = close < vwap and close < ema20 and superTrendDirection == -1 and rsi < 50 and close < bbMid and close < psar and macdLine < macdSignal and adx > 25 and stochRsi < 80

// Stop Loss & Take Profit
sl = atr * 1.5
long_sl = close - sl
short_sl = close + sl
tp = sl * 1.5
long_tp = close + tp
short_tp = close - tp

// Execute Trades
if buyCondition
    strategy.entry("Long", strategy.long)
    strategy.exit("Long Exit", from_entry="Long", stop=long_sl, limit=long_tp)

if sellCondition
    strategy.entry("Short", strategy.short)
    strategy.exit("Short Exit", from_entry="Short", stop=short_sl, limit=short_tp)

// Plot indicators
plot(vwap, title="VWAP", color=color.blue)
plot(ema20, title="EMA 20", color=color.orange)
plot(superTrend, title="SuperTrend", color=color.green)
plot(psar, title="Parabolic SAR", color=color.red, style=plot.style_cross)
plot(bbMid, title="Bollinger Mid", color=color.purple)
plot(macdLine, title="MACD Line", color=color.blue)
plot(macdSignal, title="MACD Signal", color=color.red)
plot(adx, title="ADX", color=color.green)
plot(stochRsi, title="Stochastic RSI", color=color.orange)

// Alerts
alertcondition(buyCondition, title="Buy Signal", message="Buy Signal Triggered")
alertcondition(sellCondition, title="Sell Signal", message="Sell Signal Triggered")