適応型ボリンジャーバンドトレンドフォロー戦略と多層リスク管理システム

BB EMA SL TP SMA
作成日: 2025-02-10 15:14:57 最終変更日: 2025-02-10 15:14:57
コピー: 3 クリック数: 446
1
フォロー
1617
フォロワー

適応型ボリンジャーバンドトレンドフォロー戦略と多層リスク管理システム

概要

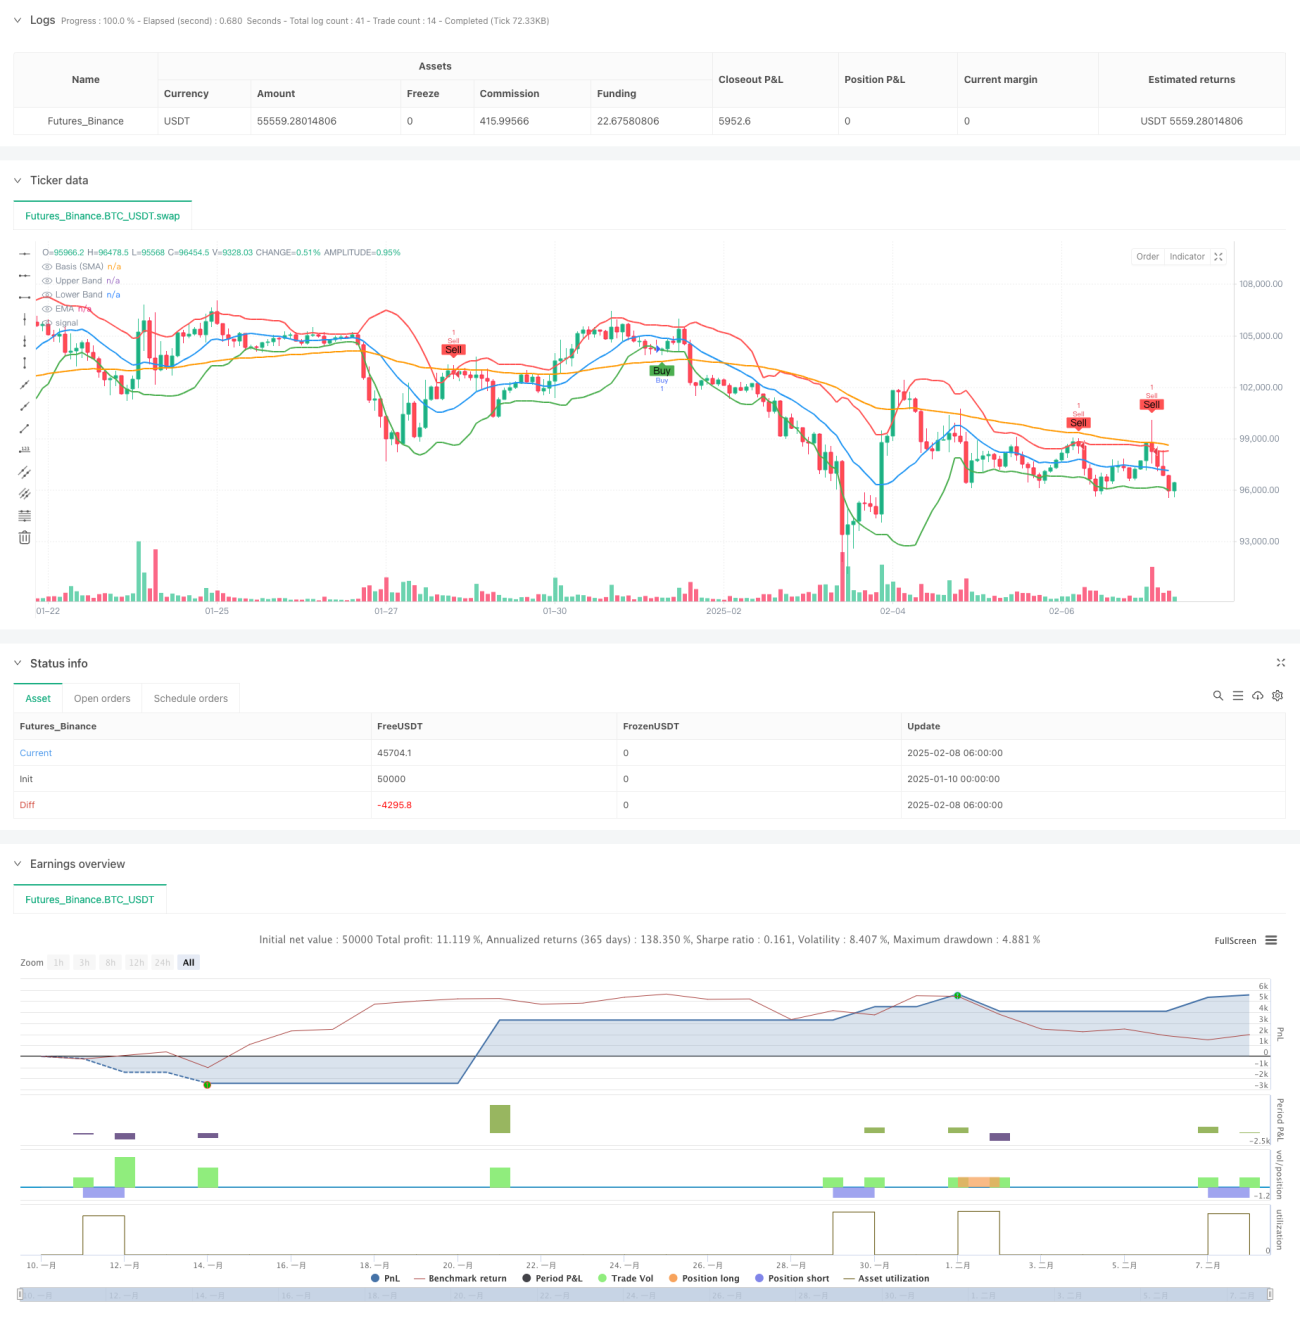
この戦略は,ブリン帯とEMA指標を組み合わせたトレンド追跡システムで,多層のリスク制御メカニズムによって取引パフォーマンスを最適化します.戦略の中心は,ブリン帯の下落の突破逆転形態を利用して市場トレンドを捕捉し,EMAトレンドフィルターと組み合わせて取引の正確性を向上させます.システムには,ストップ・ロス,固定ストップ・ロス,利益目標,時間ベースの平仓メカニズムを追跡する完全なリスク管理システムが含まれています.

戦略原則

この戦略の取引論理は,以下の核心要素に基づいています.

  1. 標準差 (STDDEV) を1.5と周期を14とするブリン帯を主要取引信号指標として使用
  2. 現在のK線の1本が上線を突破し,K線が逆転すると空調信号が発せられる.
  3. K線の一方の閉盘価格が下落し,K線が強くなると,多信号が誘発される.
  4. 選択的に80サイクルEMAをトレンドフィルターとして追加し,トレンド方向が一致している場合にのみポジションを開きます.
  5. 価格がブリン帯の中間軌道を通過するときにトラッキングストップが起動する
  6. 設定可能な固定ストップと利益の目標額
  7. K線数に基づく自動平衡メカニズムをサポート

戦略的優位性

  1. トレンドフォローと反転取引の特性を組み合わせて,異なる市場環境で安定したパフォーマンスを発揮します.
  2. 多層のリスク管理システムにより,資金管理の全般的なプログラムが提供されます.
  3. フレキシブルなパラメータ設定により,戦略は異なる市場条件に適応できます.
  4. EMAのフィルターは,偽の突破のリスクを低減します.
  5. ストップ・トラッキング・メカニズムは,利益を効果的にロックします.
  6. 長期にわたる監禁のリスクを回避する時間的平衡の仕組み

戦略リスク

  1. 不安定な市場では、誤ったブレイクアウトシグナルが頻繁に発生する可能性がある
  2. 固定金額のストップは,すべての市場条件に適合しない可能性があります.
  3. EMAのフィルタリングは重要な取引機会を逃す可能性があります.
  4. ストップ・ロスを追跡し,波動の激しい市場で早急に平定を図る
  5. パラメータの最適化により、過去のデータが過剰適合する可能性がある

戦略最適化の方向性

  1. 市場波動に合わせて動的に調整する自適化ブリン帯周期を導入
  2. 資金管理に基づくダイナミック・ストップ・ローズ・システムの開発
  3. 突破の有効性を確認する取引量分析を追加
  4. インテリジェントなパラメータ最適化システム
  5. 市場環境認識モジュールを追加し,異なる市場条件で異なるパラメータ設定を使用

要約する

これは,ブリン帯とEMAの組み合わせによって信頼性の高い取引信号を提供し,複数のレベルのリスク管理によって取引の安全性を確保する,設計されたトレンド追跡システムである.戦略は,異なる取引スタイルと市場環境に適応する強力な構成性がある.いくつかの固有のリスクがあるものの,提案された最適化の方向によって,戦略の安定性と収益性をさらに向上させることができます.

ストラテジーソースコード
/*backtest
start: 2025-01-10 00:00:00
end: 2025-02-08 08:00:00
period: 2h
basePeriod: 2h
exchanges: [{"eid":"Futures_Binance","currency":"BTC_USDT"}]
*/

//@version=5
strategy("AI Bollinger Bands Strategy with SL, TP, and Bars Till Close", overlay=true)

// Input parameters
bb_length           = input.int(14, title="Bollinger Bands Length", minval=1)
bb_stddev           = input.float(1.5, title="Bollinger Bands Standard Deviation", minval=0.1)
use_ema             = input.bool(true, title="Use EMA Filter")
ema_length          = input.int(80, title="EMA Length", minval=1)
use_trailing_stop   = input.bool(true, title="Use Trailing Stop")
use_sl              = input.bool(true, title="Use Stop Loss")
use_tp              = input.bool(false, title="Use Take Profit")
sl_dollars          = input.float(300.0, title="Stop Loss (\$)", minval=0.0)
tp_dollars          = input.float(1000.0, title="Take Profit (\$)", minval=0.0)
use_bars_till_close = input.bool(true, title="Use Bars Till Close")
bars_till_close     = input.int(10, title="Bars Till Close", minval=1)
// New input to toggle indicator plotting
plot_indicators     = input.bool(true, title="Plot Bollinger Bands and EMA on Chart")

// Calculate Bollinger Bands and EMA
basis      = ta.sma(close, bb_length)
upper_band = basis + bb_stddev * ta.stdev(close, bb_length)
lower_band = basis - bb_stddev * ta.stdev(close, bb_length)
ema        = ta.ema(close, ema_length)

// Plot Bollinger Bands and EMA conditionally
plot(plot_indicators  ? basis : na, color=color.blue, linewidth=2, title="Basis (SMA)")
plot(plot_indicators ? upper_band : na, color=color.red, linewidth=2, title="Upper Band")
plot(plot_indicators  ? lower_band : na, color=color.green, linewidth=2, title="Lower Band")
plot(plot_indicators   ? ema   : na, color=color.orange, linewidth=2, title="EMA")

// EMA conditions
ema_long_condition  = ema > ema[1]
ema_short_condition = ema < ema[1]

// Entry conditions
sell_condition = close[1] > upper_band[1] and close[1] > open[1] and close < open
if sell_condition and (not use_ema or ema_short_condition)
    strategy.entry("Sell", strategy.short)

buy_condition = close[1] < lower_band[1] and close > open
if buy_condition and (not use_ema or ema_long_condition)
    strategy.entry("Buy", strategy.long)

// Trailing stop logic
if use_trailing_stop
    if strategy.position_size > 0 and close >= basis
        strategy.exit("Trailing Stop Long", from_entry="Buy", stop=low)
    if strategy.position_size < 0 and close <= basis
        strategy.exit("Trailing Stop Short", from_entry="Sell", stop=high)

// Stop Loss and Take Profit logic
if use_sl or use_tp
    if strategy.position_size > 0
        long_entry = strategy.position_avg_price
        long_sl    = long_entry - sl_dollars
        long_tp    = long_entry + tp_dollars
        if use_sl and close <= long_sl
            strategy.close("Buy", comment="Long SL Hit")
        if use_tp and close >= long_tp
            strategy.close("Buy", comment="Long TP Hit")
    if strategy.position_size < 0
        short_entry = strategy.position_avg_price
        short_sl    = short_entry + sl_dollars
        short_tp    = short_entry - tp_dollars
        if use_sl and close >= short_sl
            strategy.close("Sell", comment="Short SL Hit")
        if use_tp and close <= short_tp
            strategy.close("Sell", comment="Short TP Hit")

// Bars Till Close logic
var int bars_since_entry = na
if strategy.position_size != 0
    bars_since_entry := na(bars_since_entry) ? 0 : bars_since_entry + 1
else
    bars_since_entry := na

if use_bars_till_close and not na(bars_since_entry) and bars_since_entry >= bars_till_close
    strategy.close("Buy", comment="Bars Till Close Hit")
    strategy.close("Sell", comment="Bars Till Close Hit")

// Plot buy/sell signals
plotshape(sell_condition and (not use_ema or ema_short_condition), title="Sell Signal", location=location.abovebar, color=color.red, style=shape.labeldown, text="Sell")
plotshape(buy_condition and (not use_ema or ema_long_condition), title="Buy Signal", location=location.belowbar, color=color.green, style=shape.labelup, text="Buy")