
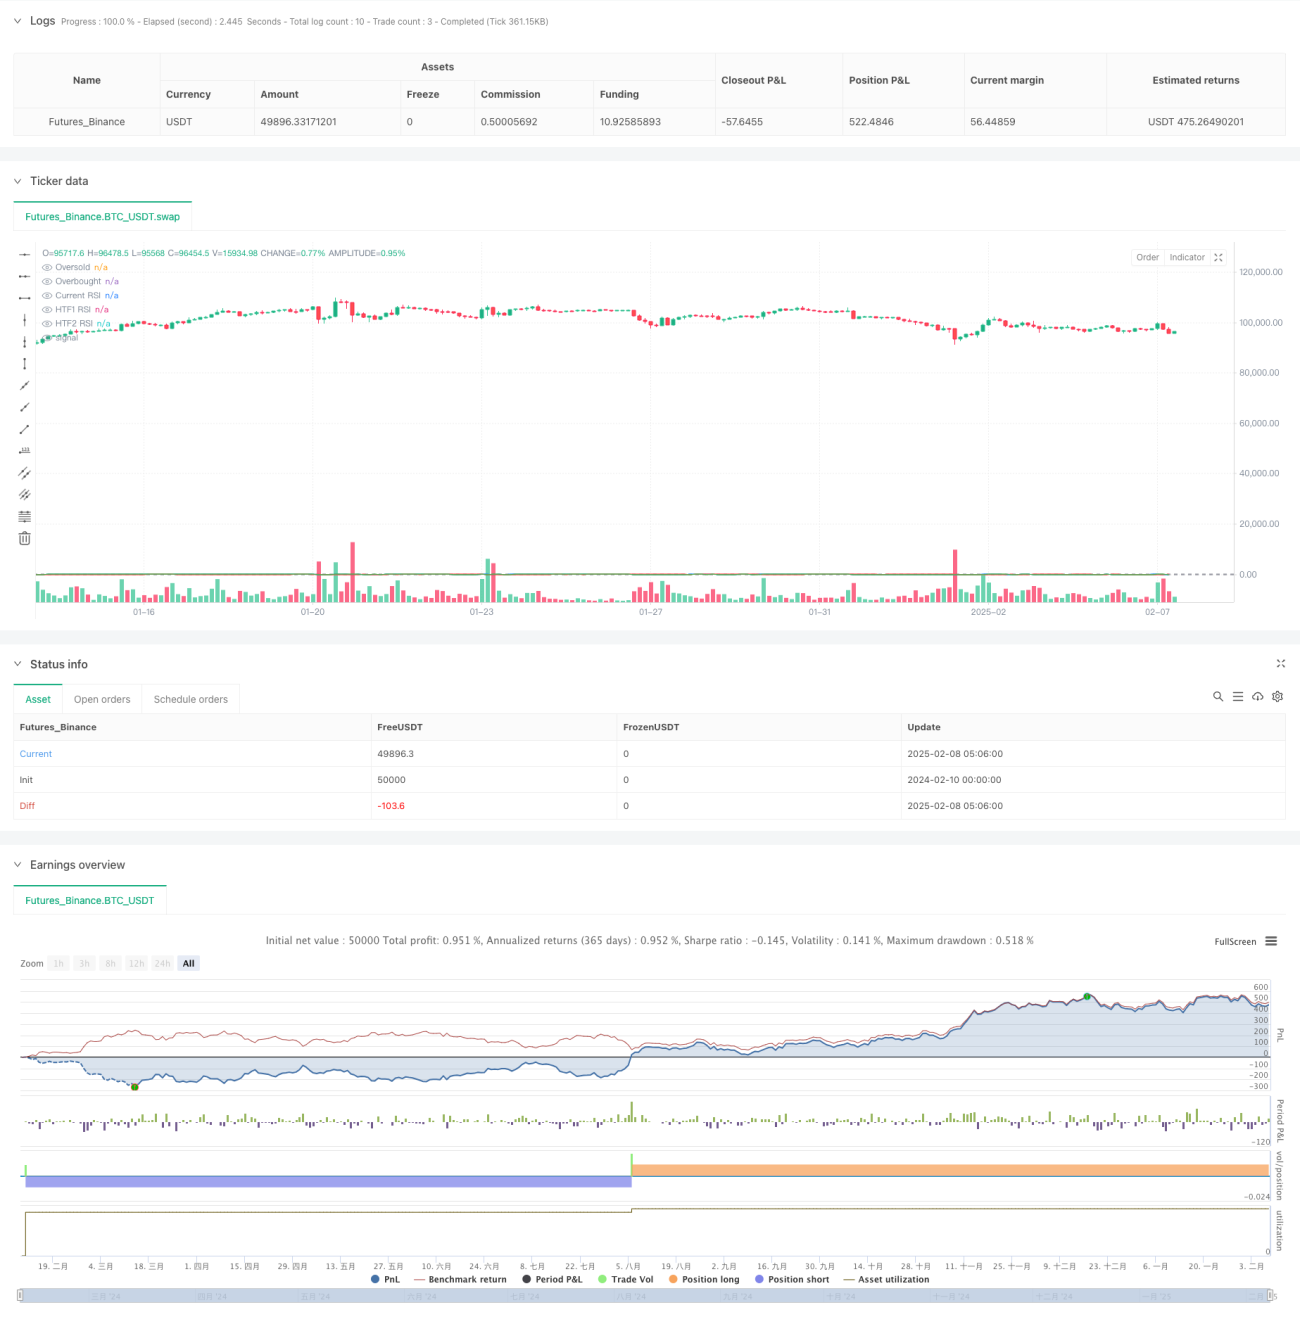
この戦略は,複数のタイムサイクルRSI指標とダイナミックグリッドの取引システムを組み合わせた複合型戦略である.これは,3つの異なるタイムサイクルRSI指標値を分析することによって,市場のオーバーバイオーバーセール状態を識別し,ATRベースのダイナミックグリッドシステムを用いてポジション管理を行う.この戦略には,毎日のストップ,最大撤回保護などのリスク制御機構が含まれ,利益とリスクを効果的にバランスすることができます.
戦略の中核となるロジックには、次の主要な部分が含まれます。
この戦略は,多時間周期RSI分析とダイナミック・グリッド・トレーディング・システムと組み合わせて,バランスの取れた取引方案を作成している. 完善したリスク管理機構と柔軟なパラメータ設定により,異なる市場環境に適用できる. 提案された最適化方向によって,戦略の安定性と収益性をさらに向上させることができる.
/*backtest
start: 2024-02-10 00:00:00
end: 2025-02-08 08:00:00
period: 3h
basePeriod: 3h
exchanges: [{"eid":"Futures_Binance","currency":"BTC_USDT"}]
*/
//@version=5
strategy("Multi-Timeframe RSI Grid Strategy with Arrows", overlay=true)
// Input parameters
rsi_length = input.int(14, "RSI Length")
oversold = input.int(30, "Oversold Level")
overbought = input.int(70, "Overbought Level")
higher_tf1 = input.string("60", "Higher Timeframe 1")
higher_tf2 = input.string("240", "Higher Timeframe 2")
grid_factor = input.float(1.2, "Grid Multiplication Factor", step=0.1)
lot_multiplier = input.float(1.5, "Lot Multiplication Factor", step=0.1)
max_grid = input.int(5, "Maximum Grid Levels")
daily_target = input.float(4.0, "Daily Profit Target (%)", step=0.5)
atr_length = input.int(14, "ATR Length")
// Calculate RSI values
current_rsi = ta.rsi(close, rsi_length)
higher_tf1_rsi = request.security(syminfo.tickerid, higher_tf1, ta.rsi(close, rsi_length))
higher_tf2_rsi = request.security(syminfo.tickerid, higher_tf2, ta.rsi(close, rsi_length))
// Grid system variables
var int grid_level = 0
var float last_entry_price = na
var float base_size = strategy.equity * 0.01 / close
var float daily_profit_target = strategy.equity * (daily_target / 100)
var bool target_reached = false
// ATR for grid spacing
atr = ta.atr(atr_length)
grid_space = atr * grid_factor
// Daily reset
new_day = ta.change(time("D"))
if new_day
daily_profit_target := strategy.equity * (daily_target / 100)
target_reached := false
grid_level := 0
last_entry_price := na
// Trading conditions
buy_condition = current_rsi < oversold and higher_tf1_rsi < oversold and higher_tf2_rsi < oversold
sell_condition = current_rsi > overbought and higher_tf1_rsi > overbought and higher_tf2_rsi > overbought
// Reverse signal detection
reverse_long_to_short = sell_condition and strategy.position_size > 0
reverse_short_to_long = buy_condition and strategy.position_size < 0
// Close all trades on reverse signals
if reverse_long_to_short or reverse_short_to_long
strategy.close_all()
grid_level := 0
last_entry_price := na
// Grid management logic
if strategy.position_size == 0
grid_level := 0
last_entry_price := na
if strategy.position_size > 0 and not reverse_long_to_short
if close < last_entry_price - grid_space and grid_level < max_grid and not target_reached
strategy.entry("Long Grid " + str.tostring(grid_level), strategy.long, qty=base_size * math.pow(lot_multiplier, grid_level))
grid_level += 1
last_entry_price := close
if strategy.position_size < 0 and not reverse_short_to_long
if close > last_entry_price + grid_space and grid_level < max_grid and not target_reached
strategy.entry("Short Grid " + str.tostring(grid_level), strategy.short, qty=base_size * math.pow(lot_multiplier, grid_level))
grid_level += 1
last_entry_price := close
// Initial entry
if buy_condition and strategy.position_size == 0 and not target_reached
strategy.entry("Long", strategy.long, qty=base_size)
grid_level := 1
last_entry_price := close
if sell_condition and strategy.position_size == 0 and not target_reached
strategy.entry("Short", strategy.short, qty=base_size)
grid_level := 1
last_entry_price := close
// Profit target check
current_profit = strategy.netprofit + strategy.openprofit
if current_profit >= daily_profit_target and not target_reached
strategy.close_all()
target_reached := true
// Drawdown protection
if strategy.openprofit < -(0.02 * strategy.equity) // 2% drawdown protection
strategy.close_all()
grid_level := 0
last_entry_price := na
// Plot Buy and Sell Arrows
plotshape(series=buy_condition and strategy.position_size == 0, title="Buy Signal", location=location.belowbar, color=color.green, style=shape.labelup, text="BUY", size=size.small)
plotshape(series=sell_condition and strategy.position_size == 0, title="Sell Signal", location=location.abovebar, color=color.red, style=shape.labeldown, text="SELL", size=size.small)
// Plotting RSI
plot(current_rsi, "Current RSI", color=color.blue)
plot(higher_tf1_rsi, "HTF1 RSI", color=color.red)
plot(higher_tf2_rsi, "HTF2 RSI", color=color.green)
hline(oversold, "Oversold", color=color.gray)
hline(overbought, "Overbought", color=color.gray)