デュアル移動平均-RSIモメンタムトレンドフォロー戦略

1
Follow
1781
Followers
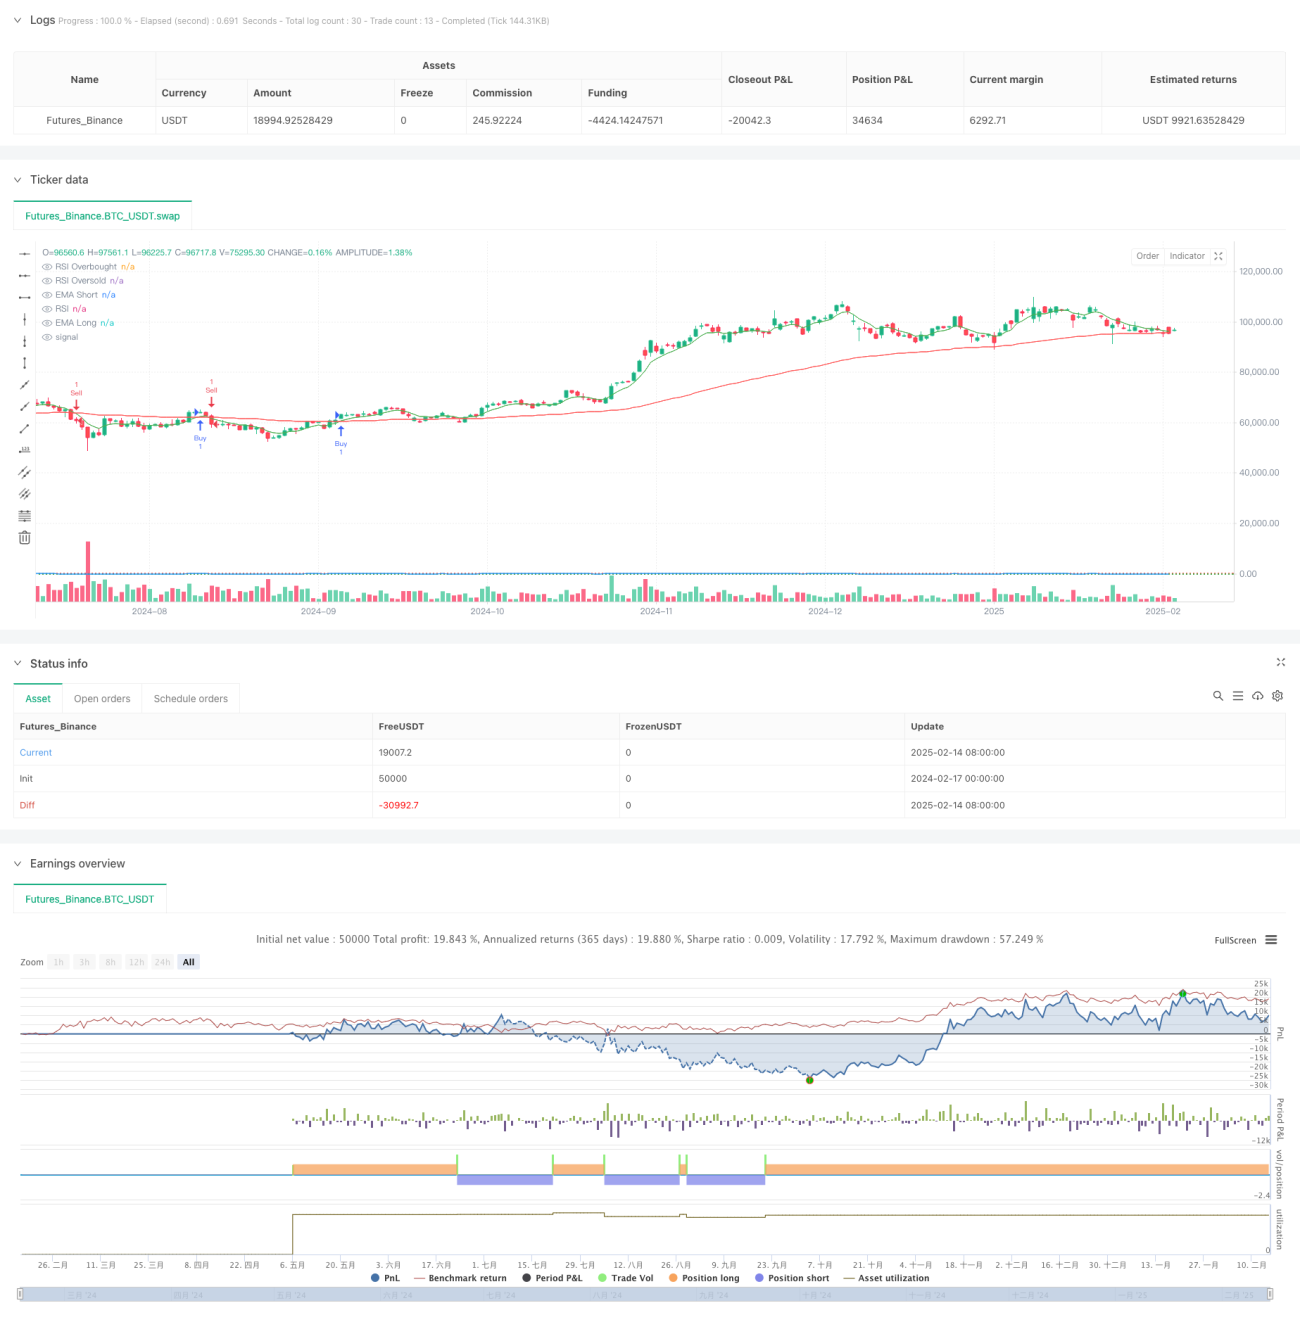
概要
この戦略は,二重均線システムとRSI指標に基づくトレンド追跡取引システムである.この戦略は,均線交差信号,RSI超買い超売判断,価格突破確認を組み合わせて,複数のフィルタリングの取引意思決定フレームワークを構築する.この戦略は,6サイクルと82サイクルの指数移動平均 ((EMA) を介して中短期トレンドを捕捉し,比較的強い指数 ((RSI) を利用して市場の過熱と過冷状況をフィルタリングし,最終的に価格突破によって取引信号を確認する.
戦略原則
戦略の核心的な論理は,信号フィルタリングの3次元である.
- トレンド判断:急速EMA ((6サイクル) と遅いEMA ((82サイクル) の交差を用いてトレンド方向を判断する.速線上での遅い線を横切るときに多多信号が発生し,速線下での遅い線を横切るときに空白信号が発生する.
- 動量フィルタ:14サイクルRSI指標を使用して過度に追いつくのをフィルタリングする.RSIが70以上の場合,市場が過熱しすぎると考えられ,過剰を抑制する.RSIが22未満の場合は,市場が過冷しすぎると考えられ,空白を抑制する.
- 価格確認:入場時に価格突破確認が必要である.多行は閉店価格の創新高を要求し,空白は閉店価格の創新低を要求する.
戦略的優位性
- 多重信号フィルタリング:技術指標と価格行動を組み合わせて,厳格な信号フィルタリング機構を構築し,偽信号を効果的に減少させることができる.
- トレンド・トラッキングと動力の組み合わせ: 継続的なトレンドを捉えながらも,過度に追いつかないようにする.
- パラメータの調整性:戦略の重要なパラメータ,例えば平均線周期,RSI<unk>値など,異なる市場の特徴に応じて最適化することができます.
- リスク管理の改善:RSIの超買い超売り判断により,リスク管理の仕組みが内蔵されている.
戦略リスク
- 振動市場リスク:横盤振動市場では,均線交差シグナルが頻繁に発生し,過剰な取引を引き起こします.
- 遅滞のリスク: EMAとRSIは遅滞性があり,市場が急激に変化する時に反応しなくなる可能性があります.
- 参数感性: 戦略効果は,参数選択に敏感であり,異なる市場環境では異なる参数組み合わせが必要になる可能性がある.
- 信号の希少性:複数のフィルタリングメカニズムにより,有効な信号が少なくなり,戦略の利益の機会に影響を与える可能性があります.
戦略最適化の方向性
- 動的パラメータ調整:自調メカニズムを導入し,市場変動率の動的調整により平均線周期とRSI<unk>値を調整することができる.
- ストップメカニズム導入:移動ストップまたは固定ストップのルールを追加し,リスク管理能力を向上させる.
- 市場環境分類:市場環境判断モジュールを追加し,異なる市場状態で異なるパラメータの組み合わせを使用する.
- 信号強度階層:信号条件を満たす程度に基づいて階層システムを設計することができ,保有規模を調整するために使用される.
要約する
この戦略は,均線システムとRSI指標の巧妙な組み合わせによって,論理的に厳格なトレンド追跡システムを構築しています.戦略の複数のフィルタリング機構は,リスクを効果的に制御していますが,一部の取引機会を逃す可能性もあります.継続的な最適化と改善により,戦略は,異なる市場環境で安定したパフォーマンスを維持することが期待されています.
Source
Pine
Strategy parameters
Related strategies
Comment
All comments (0)
No data
- 1