モメンタムとボリュームに基づくマルチインジケータートレンド反転戦略

1
Follow
1781
Followers
概要
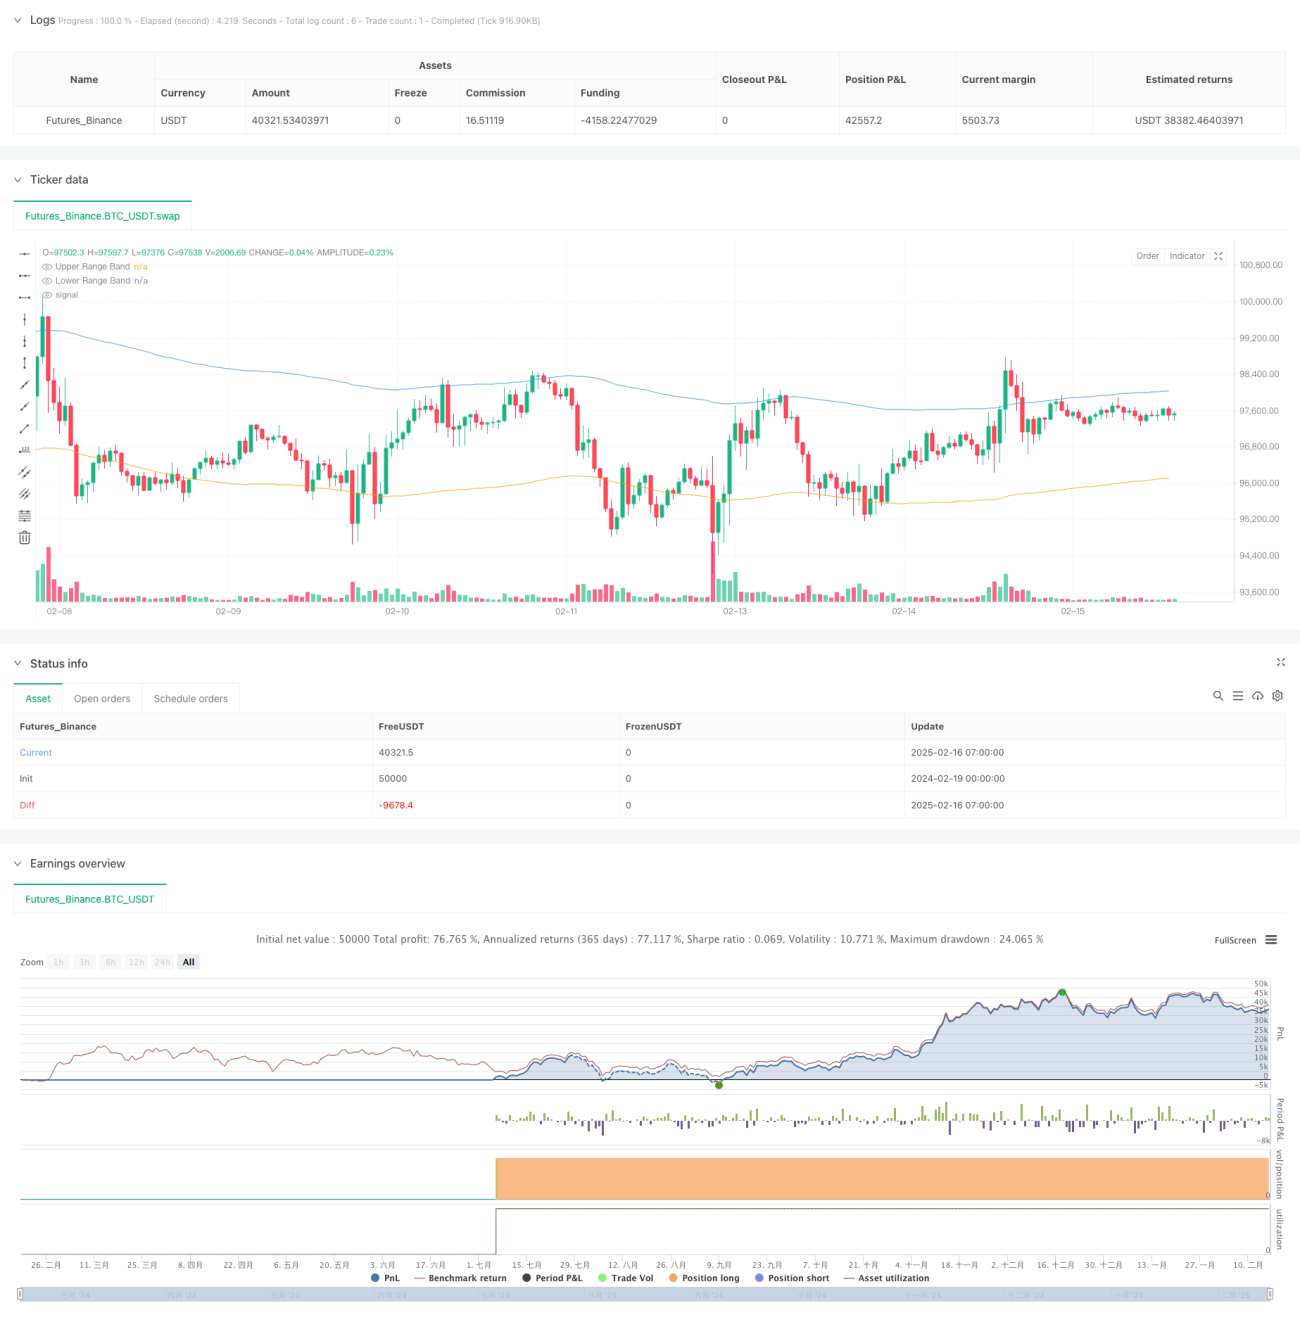
この戦略は,動量指標 ((MACD,RSI) と交替量フィルターの組み合わせによるトレンド反転取引システムである.範囲フィルターの導入によって価格変動の監視が実現され,市場のトップとボトムを正確にキャプチャする.この戦略は,従来の技術指標に基づいて交替量確認機構が加えられ,取引信号の信頼性が向上する.
戦略原則
複数の指標を検証した取引戦略:
- MACD指標は,価格動力の変化を捉え,トレンドの転換点を確認するために,高速線と遅い線の交差点を使用します.
- RSI指標は,RSIがピークに達したときに潜在的反転の機会を探すために,市場の過剰買いと過剰売り状態を監視します.
- 範囲フィルター 価格の平滑な範囲帯を計算し,トレードが傾向から顕著な位置で発生することを保証する
- 交付量フィルターは,取引信号が量量確認されなければならないことを要求し,信号の信頼性を高めます.
多重条件の共演トリガーは以下の通りです.
- 多項条件:MACD金叉 + RSIは超売り領域にある + 価格は下位軌道より低い + 取引量は平均より高い
- 空白条件:MACDデッドフォーク + RSIは超買い領域にいます + 価格が上線より高い + 取引量は平均より高い
戦略的優位性
- 複数の指標のクロス検証により,信号の正確性が向上し,偽信号の干渉を効果的に軽減する.
- 範囲フィルターの導入は,価格が大きく偏っている位置で取引を確実にし,潜在的利益の余地を増やす
- 取引量確認メカニズムは,流動性の低い環境で誤判を回避し,取引の信頼性を高める
- 戦略パラメータは,異なる市場環境と取引品種の特性に合わせて柔軟に調整できます.
- 明確な信号生成ロジックは,リアルタイムの監視と反響分析を容易にする
戦略リスク
- 多重条件の厳格な要求は,潜在的な取引機会の一部を逃す可能性があります.
- 不安定な市場では取引シグナルが頻繁に発生し、取引コストが増加する可能性がある。
- パラメータの選択は,十分な市場経験と歴史的データによるサポートを必要とします.
- 極端な市場環境では,技術指標の有効性が影響を受ける可能性があります.
リスク管理の提案:
- 十分なパラメータ最適化と反テストの検証を推奨する
- 損害防止装置の導入を検討
- 市場環境の変化に注目し,戦略のパラメータを適時に調整する
戦略最適化の方向性
- 市場変動の動向に応じて指標パラメータを調整する適応パラメータメカニズムを導入する
- 市場環境認識モジュールを追加し,異なる市場状態で異なるシグナルフィルタリングルールを適用する
- 取引量フィルターを最適化し,取引量形状分析の導入を検討
- 価格形状認識機能が追加され,より多くの反転確認信号が提供されます.
- スマートマネジメントモジュール開発,ポジション規模とリスク管理の最適化
要約する
この戦略は,複数の技術指標の協調的な配合によって,比較的完ぺきなトレンド反転取引システムを構築している.戦略の核心的な優位性は,厳格なシグナルフィルタリング機構と柔軟なパラメータ調整スペースにある.継続的な最適化と改善により,戦略は,さまざまな市場環境で安定したパフォーマンスを維持すると見込まれている.実際の適用では,投資家は,自身のリスク好みと市場経験に基づいて戦略パラメータをターゲットに調整することを推奨している.
Source
Pine
Strategy parameters
Related strategies
Comment
All comments (0)
No data
- 1