
1
Follow
1789
Followers
概要
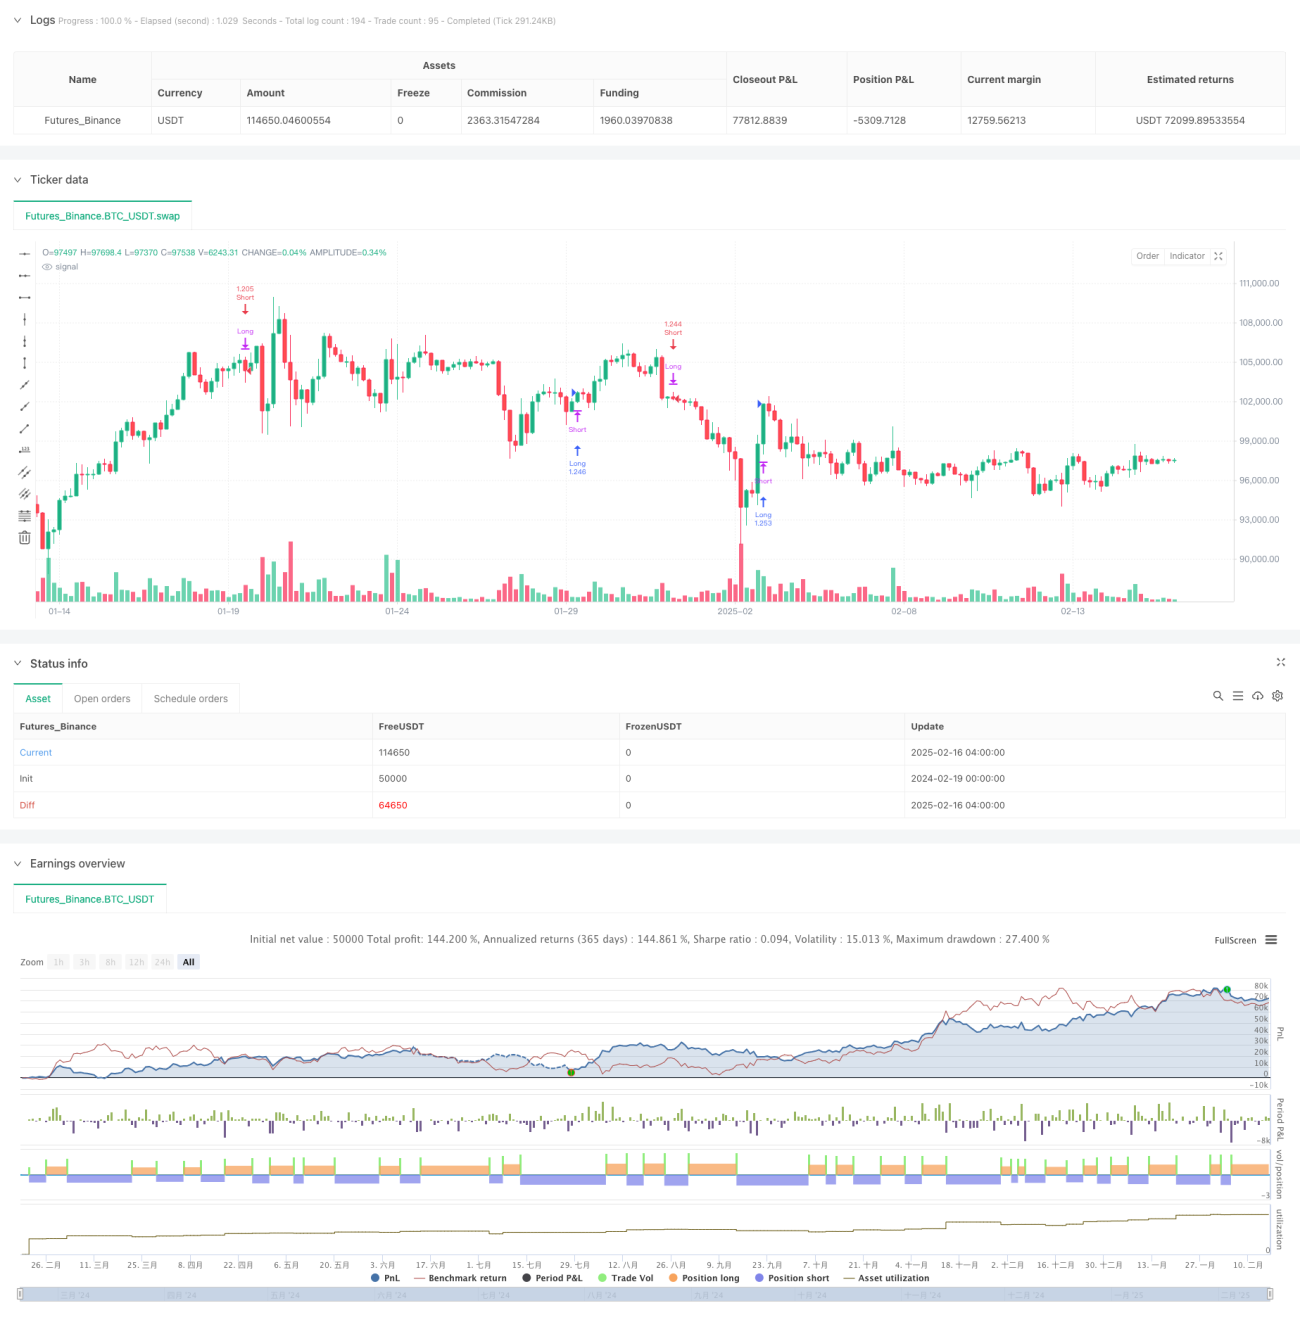
本戦略は、改良型相対力指数(RSI)を基盤としたトレンドフォロー型の取引システムです。拡張RSIを計算し、そのシグナルラインと組み合わせることで、異なる市場サイクルにおけるトレンド反転の機会を捉えます。指標値を算出するだけでなく、視覚的に買われすぎ・売られすぎの領域を表示することで、トレーダーが市場の状態を直感的に判断できるようにします。
戦略の原理
本戦略の核となる原理は、拡張RSI(ARSI)の計算を通じて市場トレンドを識別することです。具体的には以下の要素を含みます:
- 指定期間内の最高価格と最低価格から価格範囲を計算
- 価格変動に基づいて差分を算出
- 任意の移動平均手法(EMA、SMA、RMA、TMA)を用いて差分を平滑化
- 結果を0~100の範囲に正規化
- ARSIが50未満でシグナルラインを上抜けた場合に買いシグナルを生成
- ARSIが50以上でシグナルラインを下抜けた場合に売りシグナルを生成
戦略の優位性
- シグナル確認メカニズムが充実 – ARSIとシグナルラインのクロス、および中央線フィルターによりシグナルの信頼性を確保
- 適応性が高い – 複数の移動平均手法に対応し、市場特性に応じて調整可能
- リスク管理が合理的 – ポジション割合管理により、各取引のリスクを効果的に制御
- 視覚効果が優れている – 色塗りで買われすぎ・売られすぎ領域を明確に表示し、素早い判断を支援
- 逆方向ポジション管理 – 逆シグナル発生時に既存ポジションを自動的にクローズし、両建てリスクを回避
戦略のリスク
- レンジ相場のリスク – 横ばいの相場では頻繁な偽シグナルが発生する可能性
- ラグのリスク – 移動平均を使用するため、シグナルに一定の遅れが生じる
- パラメータ感応性 – パラメータ設定の違いにより戦略のパフォーマンスが大きく変動する可能性
- 市場適応リスク – 市場環境によって戦略のパフォーマンスが大きく異なる可能性
- 資金管理リスク – 固定割合のポジション管理は、急激な変動時に大きなリスクをもたらす可能性
戦略の最適化方向性
- ボラティリティフィルターの導入 – ATR指標を追加し、低ボラティリティ環境での取引シグナルをフィルタリング
- トレンド確認指標の追加 – より長い期間のトレンド指標と組み合わせてシグナルの信頼性を向上
- ポジション管理の最適化 – 市場のボラティリティに応じてポジション比率を動的に調整
- ストップロス機構の追加 – ATRベースの動的ストップロスを設定し、リスクをより適切に管理
- 適応的パラメータの開発 – パラメータの動的最適化手法を研究し、戦略の適応性を向上
まとめ
本戦略は、構造が整い、論理が明確なトレンドフォロー戦略です。改良型RSIの革新的な計算方法と複数のテクニカル指標の利点を組み合わせることで、信頼性の高い取引システムを構築しています。固有のリスクは存在するものの、適切な最適化とリスク管理措置により、実践的な応用が期待されます。実際の取引で使用する際には、パラメータ設定を十分にテストし、市場環境に応じて戦略の構成を適宜調整することを推奨します。
Source
Pine
/*backtest
start: 2024-02-19 00:00:00
end: 2025-02-16 08:00:00
period: 4h
basePeriod: 4h
exchanges: [{"eid":"Futures_Binance","currency":"BTC_USDT"}]
*/

//@version=6
strategy("Ultimate RSI [LuxAlgo] Strategy", shorttitle="ULT RSI Strat", overlay=false, initial_capital=10000, currency=currency.USD, default_qty_type=strategy.percent_of_equity, default_qty_value=100)

//------------------------------------------------------------------------------Strategy parameters
Related strategies
Comment
All comments (0)
No data
- 1