ATR ダイナミックトレンド追跡と再エントリー取引戦略

ATR SMA MA
作成日: 2025-02-18 15:11:28 最終変更日: 2025-02-18 15:11:28
コピー: 1 クリック数: 362
1
フォロー
1617
フォロワー

ATR ダイナミックトレンド追跡と再エントリー取引戦略

概要

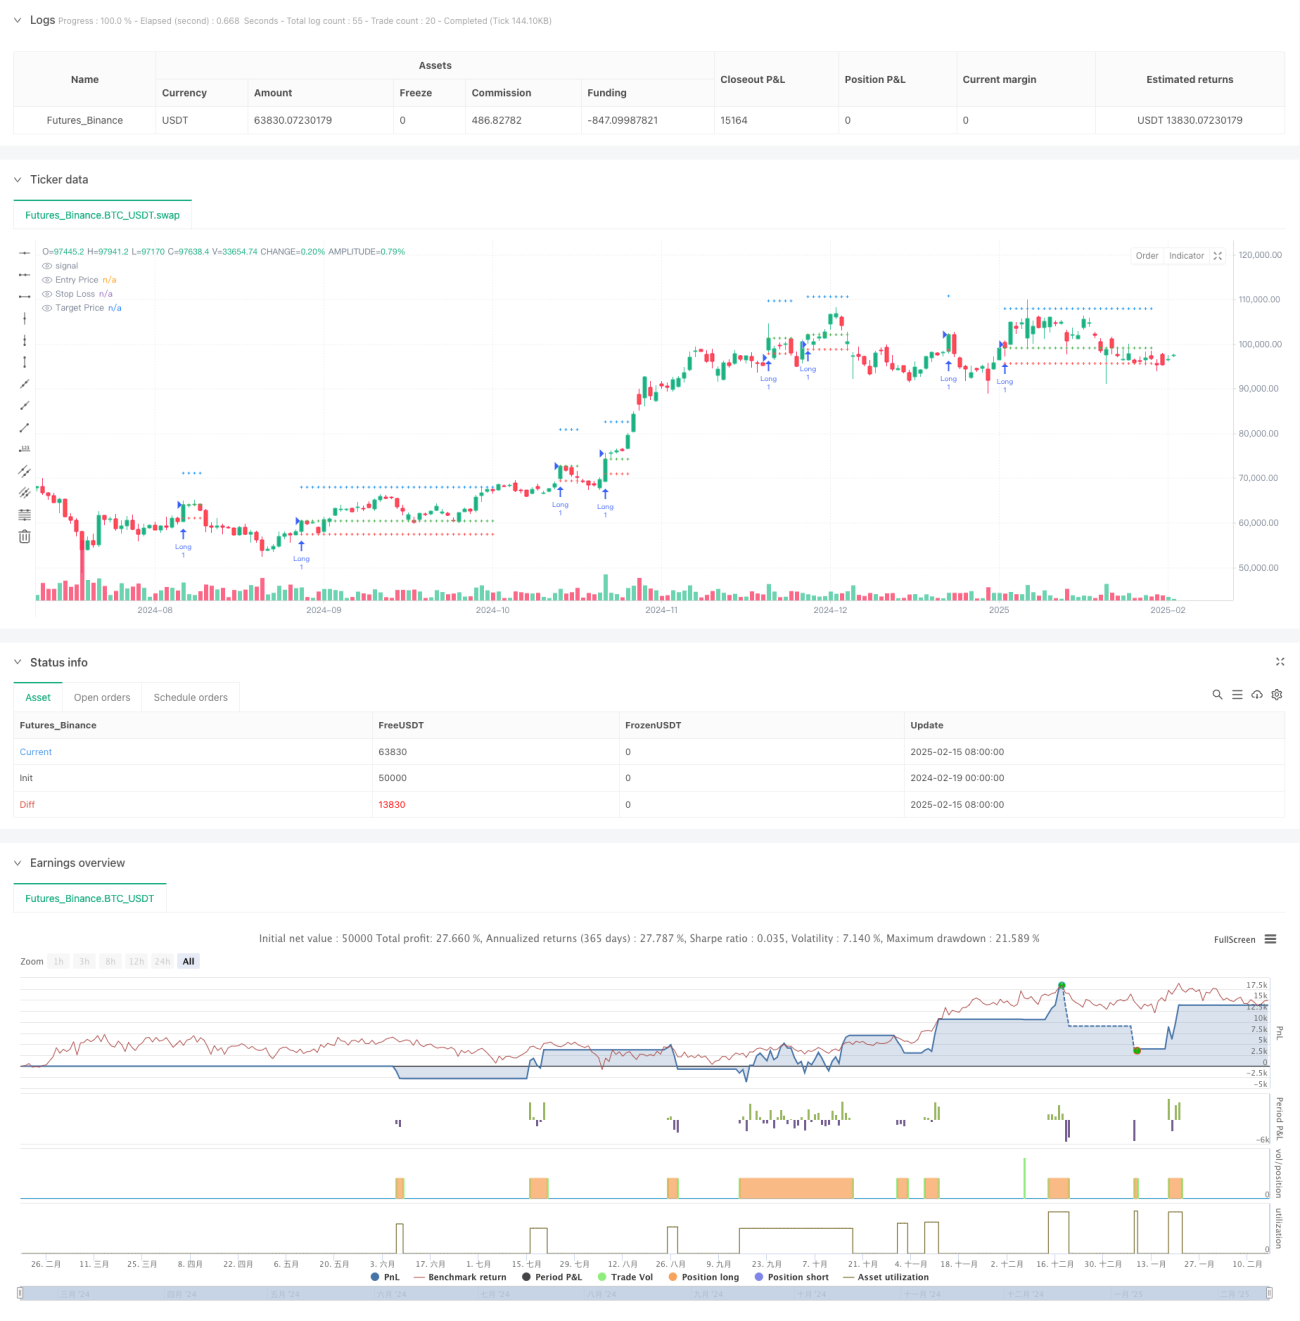
これはATR動態調整に基づくトレンド追跡戦略で,移動平均とATR指標を組み合わせて入場と出場の位置を決定する.この戦略の核心は,ATR動態調整による移動平均の上下軌道,価格が軌道上を突破したときに入場を多めにすること,ATR倍数に基づくストップとストップポイントを設定することである.また,戦略には,価格が入場地点に戻ったときに再ポジションを許可する革新的な再エントリーメカニズムが含まれている.

戦略原則

この戦略は以下の要素に基づいて機能します.

  1. ATR調整後の移動平均をトレンドの判断基準として使用し,動的な上下軌道を形成する
  2. 価格が上位に突破すると,複数のシグナルが生み出され,入場価格は現在の閉店価格になります.
  3. ストップ・ロスは入場価格の2倍ATRの距離に設定されます.
  4. ストップ位置は入場価格の上の位置に設定されます.
  5. ストップまたはストップが触発された後,価格が元の入場価格に戻ると,戦略は自動的に再入場します.
  6. グラフの表示を最適化するために最大30Kラインの表示制限を使用

戦略的優位性

  1. ダイナミックな適応性:ATRで調整された移動平均は,市場の変動率の変化に適応します.
  2. リスク管理の科学: 市場変動特性を反映したATRの動的設定に基づくストップとストップポイント
  3. 再入場メカニズムの革新:価格が有利な位置に戻ったときに再入場を許可し,収益の機会を向上させる
  4. 優れた視覚効果:戦略は,取引を監視するために,入場,止損,停止ラインを明確に表示します.
  5. パラメータの柔軟性: パラメータの入力でトレンド判断周期とストップ倍数を調整できます.

戦略リスク

  1. トレンド反転リスク: 波動的な市場では頻繁にストップを誘発する可能性があります.
  2. 再入場リスク:入場地点への価格の引き戻し,再建は連続的なストローに直面する可能性があります.
  3. スライドポイントリスク: 波動が激しい時期には,実際の取引価格がシグナル価格と偏差している可能性がある
  4. パラメータの感受性:異なる市場条件で最適なパラメータは大きく変化する可能性がある
  5. 計算負荷:複数の技術指標をリアルタイムで計算する必要があり,システム負荷が増加する可能性があります.

戦略最適化の方向性

  1. 市場環境フィルターの導入:波動率のフィルターを追加し,波動が大きいときに戦略パラメータを調整するか,取引を一時停止する
  2. 再入学ロジックを最適化:トレンド確認指標などの再入学時により厳しい条件の制限を考慮する
  3. トレンドの継続に際して,より多くの利益を保護するために,移動式ストップ機能を実現する.
  4. タイムフィルターを追加:低流動性の期間を回避するために,取引時間制限を追加できます.
  5. 計算効率の最適化:不必要な計算と図を減らすことで戦略の実行効率を向上させる

要約する

これは,合理的で論理的に明確なトレンド追跡戦略を設計し,ATRの動的調整によって優れた市場適応性を提供している.戦略の再入場機構は,市場が良好な条件下で追加の収益の機会を提供できる革新的な点である.注意すべきいくつかのリスク点があるが,提案された最適化の方向によって戦略の安定性と収益性をさらに向上させることができる.体系的な取引方法を求める投資家にとって,これは考慮すべき基本的な戦略の枠組みである.

ストラテジーソースコード
/*backtest
start: 2024-02-19 00:00:00
end: 2025-02-16 08:00:00
period: 1d
basePeriod: 1d
exchanges: [{"eid":"Futures_Binance","currency":"BTC_USDT"}]
*/

//@version=6
strategy("KON SET By Sai", overlay=true, max_lines_count=40)

// INPUTS
length = input.int(10, "Trend Length")
target_multiplier = input.int(0, "Set Targets") // Target adjustment
max_bars = 30  // Number of bars to display the lines after signal

// VARIABLES
var bool inTrade = false
var float entryPrice = na
var float stopLoss = na
var float targetPrice = na
var int barCount = na  // Counter to track how many bars have passed since signal

// ATR for stop-loss and target calculation
atr_value = ta.sma(ta.atr(200), 200) * 0.8

// Moving averages for trend detection
sma_high = ta.sma(high, length) + atr_value
sma_low = ta.sma(low, length) - atr_value

// Signal conditions for trend changes
signal_up = ta.crossover(close, sma_high)
signal_down = ta.crossunder(close, sma_low)

// Entry conditions
if not inTrade and signal_up
    entryPrice := close
    stopLoss := close - atr_value * 2
    targetPrice := close + atr_value * (5 + target_multiplier)
    strategy.entry("Long", strategy.long)
    strategy.exit("Exit Long", "Long", stop=stopLoss, limit=targetPrice)
    inTrade := true
    barCount := 0  // Reset bar count when signal occurs

// Exit conditions
if inTrade and (close <= stopLoss or close >= targetPrice)
    inTrade := false
    entryPrice := na
    stopLoss := na
    targetPrice := na
    barCount := na  // Reset bar count on exit

// Re-entry logic
if not inTrade and close == entryPrice
    entryPrice := close
    stopLoss := close - atr_value * 2
    targetPrice := close + atr_value * (5 + target_multiplier)
    strategy.entry("Re-Long", strategy.long)
    strategy.exit("Re-Exit Long", "Re-Long", stop=stopLoss, limit=targetPrice)
    inTrade := true
    barCount := 0  // Reset bar count when re-entry happens

// Count bars since the signal appeared (max 30 bars)
if inTrade and barCount < max_bars
    barCount := barCount + 1

// Plotting lines for entry, stop-loss, and targets (Only during active trade and within max_bars)
entry_line = plot(inTrade and barCount <= max_bars ? entryPrice : na, title="Entry Price", color=color.new(color.green, 0), linewidth=1, style=plot.style_cross)
sl_line = plot(inTrade and barCount <= max_bars ? stopLoss : na, title="Stop Loss", color=color.new(color.red, 0), linewidth=1, style=plot.style_cross)
target_line = plot(inTrade and barCount <= max_bars ? targetPrice : na, title="Target Price", color=color.new(color.blue, 0), linewidth=1, style=plot.style_cross)

// Background color between entry and target/stop-loss (Only when inTrade and within max_bars)
fill(entry_line, target_line, color=color.new(color.green, 90), title="Target Zone")
fill(entry_line, sl_line, color=color.new(color.red, 90), title="Stop-Loss Zone")

// Label updates (reduce overlap and clutter)
if bar_index % 50 == 0 and inTrade and barCount <= max_bars  // Adjust label frequency for performance
    label.new(bar_index + 1, entryPrice, text="Entry: " + str.tostring(entryPrice, "#.##"), style=label.style_label_left, color=color.green, textcolor=color.white, size=size.small)
    label.new(bar_index + 1, stopLoss, text="Stop Loss: " + str.tostring(stopLoss, "#.##"), style=label.style_label_left, color=color.red, textcolor=color.white, size=size.small)
    label.new(bar_index + 1, targetPrice, text="Target: " + str.tostring(targetPrice, "#.##"), style=label.style_label_left, color=color.blue, textcolor=color.white, size=size.small)