動的線形回帰チャネルとハインツ出口最適化取引戦略

LR HA TP/SL VOL STD
作成日: 2025-02-18 15:18:08 最終変更日: 2025-02-18 15:18:08
コピー: 2 クリック数: 374
1
フォロー
1617
フォロワー

動的線形回帰チャネルとハインツ出口最適化取引戦略

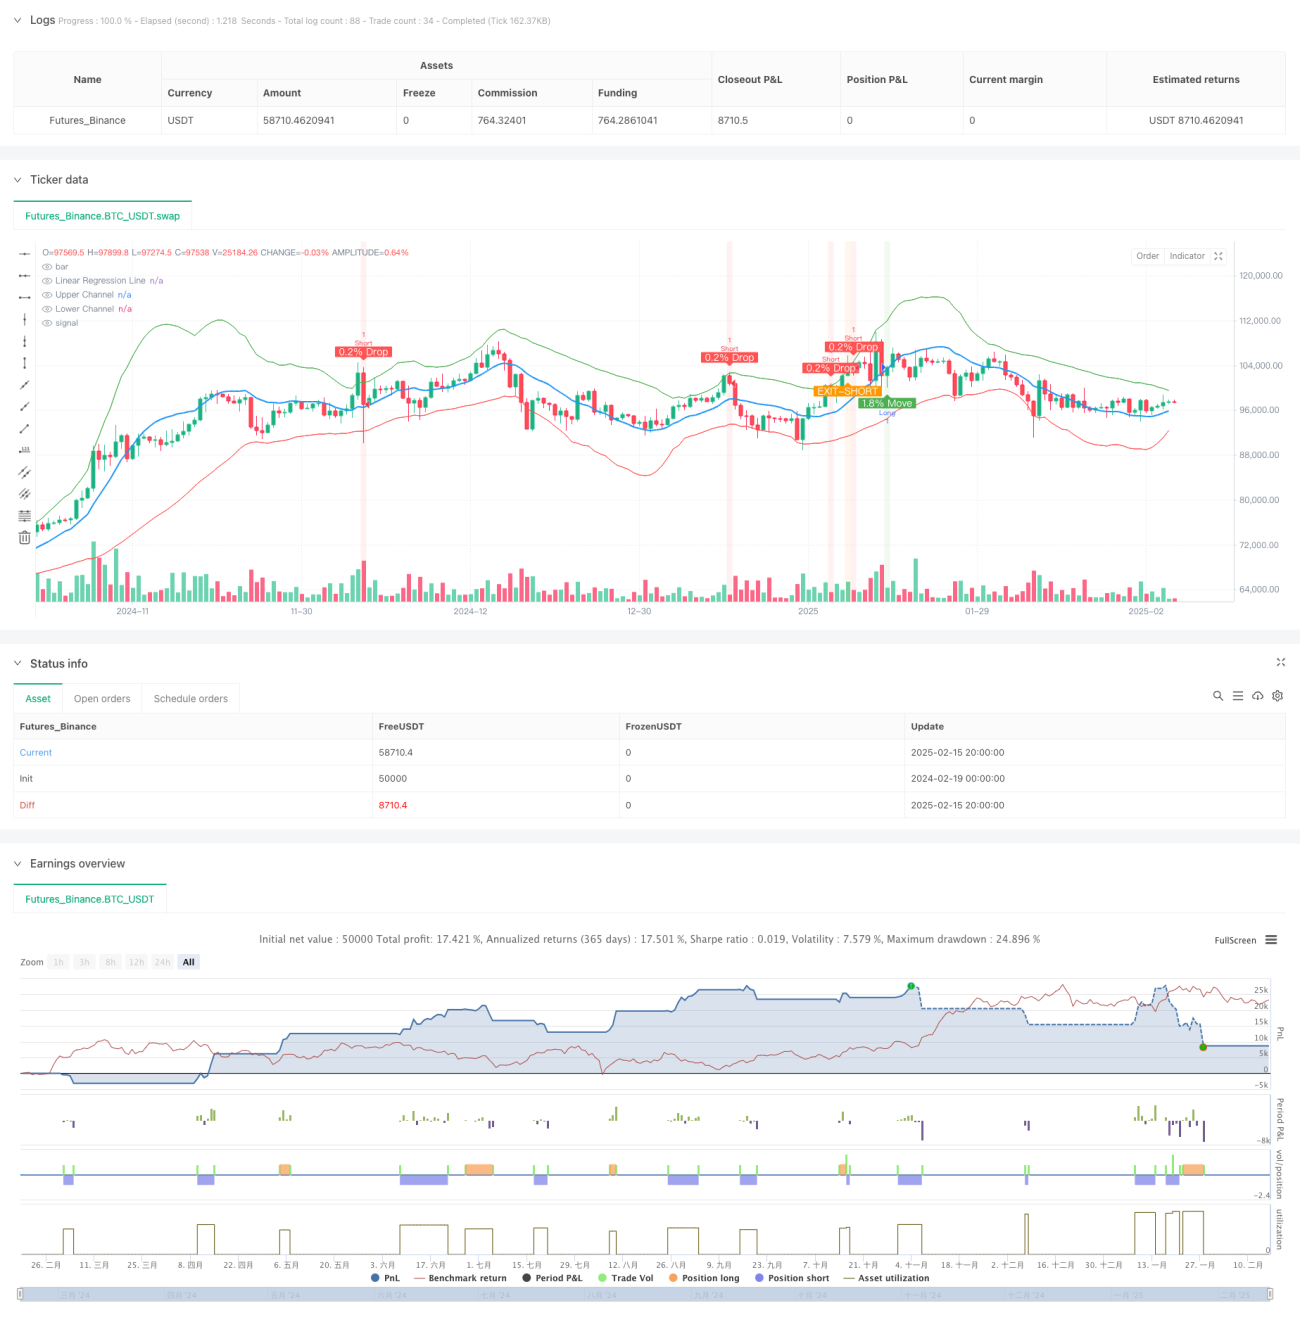
この戦略は,線形回帰通路とハインアンスグラフに基づく定量取引システムであり,ダイナミックなストップ・ストップ・損失機構を組み合わせ,市場における急速な波動の機会を把握するために特別に設計されています.

戦略概要

この戦略は,線形回帰チャネルを主要取引の枠組みとして使用し,チャネル内の価格の動きをモニタリングすることによって潜在的な取引機会を識別します.価格がチャネル下線を突破して1.8%以上上昇すると,システムは複数のシグナルを発信し,価格がチャネル上線を突破して0.2%以上低下すると,システムは空白を発信します.シグナル戦略は,ハインズ・アンスチャートに基づいたダイナミック・エクスポート・システムを統合し,10%のストップアップと5%のストップダウスのリスク管理機構も使用しています.

戦略原則

戦略の核心は30周期の線形回帰計算に基づいて,標準差の2倍で通路幅を設定する.入場信号は以下の条件に基づいている.

  1. 多頭入場は,下落後1.8%以上の上昇を要求し,2時間以内に5%を超えない
  2. 空頭入場は,価格が上線した後に0.2%以上の下落を要する.
  3. 3分間のタイムフレームを使って出場時間を決定するハイアンス図
  4. 10%のストップと5%のストップを設定し,リスクをコントロールします.

戦略的優位性

  1. トレンドと反転の特徴を組み合わせて,迅速な市場機会を捉える
  2. ハインアンス図を出場指標として使用し,より堅牢な出場機構を提供
  3. 明確なリスク管理策,包括してストップ・ストップ・損失設定
  4. 線形回帰チャネルで市場のノイズをフィルタリングし,信号の質を向上させる
  5. 長期の価格変動を考慮し,大幅な上昇の後に多額の投資を避ける

戦略リスク

  1. 高波動の市場では,しばしばストップをトリガーすることがあります.
  2. 市場反応が遅くなる可能性
  3. 固定ストップ・ストラスト比率は,すべての市場状況に適していない可能性があります.
  4. 横盤市場では偽信号が多く発生する可能性がある.
  5. リアルタイムデータ計算が求められ,実行速度が要求されます.

戦略最適化の方向性

  1. 市場変動の動向に合わせてストップ・ストラスト比率の調整を提案
  2. 信号確認として交付量指標を追加できます.
  3. 線形回帰周期を導入することを検討する
  4. ハインアンス出場条件の最適化,追加の確認指標の追加が必要になる可能性
  5. 低流動性期間の取引を避けるために,取引時間フィルターを追加することをお勧めします.

要約する

この戦略は,線形回帰通路と価格突破を組み合わせた方法で,トレーダーに比較的完全な取引システムを提供しています.その優点は,複数の技術指標とリスク管理の措置を組み合わせていることにあるが,実際の市場状況に応じて最適化と調整が必要であることです.実体取引の前に十分な反射とパラメータの最適化を行うことが推奨されています.

ストラテジーソースコード
/*backtest
start: 2024-02-19 00:00:00
end: 2025-02-16 08:00:00
period: 12h
basePeriod: 12h
exchanges: [{"eid":"Futures_Binance","currency":"BTC_USDT"}]
*/

//@version=6
strategy('STRATEGY WITH SL', overlay=true)

// Parameters for Linear Regression
length = input.int(30, title='Linear Regression Length')  
mult = input.float(2.0, title='Channel Multiplier', step=0.1)  

// Calculate Linear Regression
regression_line = ta.linreg(close, length, 0)

// Calculate Standard Deviation
stddev = ta.stdev(close, length)

// Upper and Lower Channel Boundaries
upper_channel = regression_line + mult * stddev
lower_channel = regression_line - mult * stddev

// Plot the Linear Regression and Channel
plot(regression_line, color=color.blue, linewidth=2, title='Linear Regression Line')
plot(upper_channel, color=color.green, linewidth=1, title='Upper Channel')
plot(lower_channel, color=color.red, linewidth=1, title='Lower Channel')

// Parameters for Price Move Check (Indicator 1: 1.8% Move)
threshold_move = 1.8 
large_threshold_move = 5.0  
timeframe_for_large_move = 120  

// Calculate the percentage change over the last 3 minutes
priceChange = (close - close[3]) / close[3] * 100

// Calculate the percentage change over the last 2 hours (120 minutes)
priceChange2Hour = (close - close[120]) / close[120] * 100

// Condition for a price move greater than 1.8%
isPriceUp = priceChange > threshold_move

// Condition for price move greater than 5% in 2 hours (no alert if true)
isLargePriceMove = priceChange2Hour > large_threshold_move

// Parameters for Price Drop Check (Indicator 2: 0.2% Drop)
threshold_drop = 0.2 / 100  // 0.2% threshold

// Get the price 3 minutes ago
price_3min_ago = request.security(syminfo.tickerid, '3', close[1])

// Calculate the percentage drop over the last 3 minutes
price_drop = (close - price_3min_ago) / price_3min_ago

// Condition for a 0.2% drop
drop_condition = price_drop <= -threshold_drop

// Track whether the price has crossed the upper or lower Linear Regression channel
var bool lower_crossed = false
var bool upper_crossed = false
var bool move_after_cross = false  
var bool alert_sent = false

// Reset flags when price crosses channels
if (close < lower_channel)
    lower_crossed := true
    move_after_cross := false

if (close > upper_channel)
    upper_crossed := true
    alert_sent := false  

// Combine both conditions for price crossing lower and upper channels and move/drop conditions
final_condition_long = lower_crossed and isPriceUp and not move_after_cross and not isLargePriceMove
final_condition_short = upper_crossed and drop_condition and not alert_sent

// Set flags when conditions are met
if (final_condition_long)
    move_after_cross := true

if (final_condition_short)
    alert_sent := true

// Heikin-Ashi calculation for dynamic timeframe (3-minute)
heikin_open = (open + close) / 2
heikin_close = (open + high + low + close) / 4
heikin_high = math.max(high, math.max(heikin_open, heikin_close))
heikin_low = math.min(low, math.min(heikin_open, heikin_close))

// Conditions for EXIT signals based on Heikin-Ashi candle body
exit_long_condition = (heikin_open > lower_channel and heikin_close < lower_channel) or (heikin_open < lower_channel and heikin_close > lower_channel)
exit_short_condition = heikin_open < upper_channel and heikin_close > upper_channel

// Strategy logic: Enter long or short based on the combined conditions

// Long Entry Condition
if (final_condition_long)
    strategy.entry('Long', strategy.long)

// Short Entry Condition
if (final_condition_short)
    strategy.entry('Short', strategy.short)

// Exit Conditions (EXIT-LONG and EXIT-SHORT)
if (exit_long_condition)
    strategy.close('Long')

if (exit_short_condition)
    strategy.close('Short')

// Take Profit and Stop Loss
take_profit = 10 / 100  // 10% Take Profit
stop_loss = 5 / 100    // 5% Stop Loss

// Calculate Take Profit and Stop Loss levels based on entry price
long_take_profit = strategy.position_avg_price * (1 + take_profit)
long_stop_loss = strategy.position_avg_price * (1 - stop_loss)

short_take_profit = strategy.position_avg_price * (1 - take_profit)
short_stop_loss = strategy.position_avg_price * (1 + stop_loss)

// Apply Take Profit and Stop Loss for Long and Short positions
strategy.exit('Take Profit/Stop Loss Long', from_entry='Long', limit=long_take_profit, stop=long_stop_loss)
strategy.exit('Take Profit/Stop Loss Short', from_entry='Short', limit=short_take_profit, stop=short_stop_loss)

// Plot background color when the conditions are met (for visual aid)
bgcolor(final_condition_long ? color.new(color.green, 90) : na, title='Price Move Alert After Lower Channel Crossed')
bgcolor(final_condition_short ? color.new(color.red, 90) : na, title='Price Drop Alert After Upper Channel Crossed')
bgcolor(exit_long_condition ? color.new(color.blue, 90) : na, title='EXIT-LONG Alert')
bgcolor(exit_short_condition ? color.new(color.orange, 90) : na, title='EXIT-SHORT Alert')

// Plot shapes when conditions are met
plotshape(final_condition_long, style=shape.labelup, location=location.belowbar, color=color.green, text='1.8% Move', textcolor=color.white, size=size.small)
plotshape(final_condition_short, style=shape.labeldown, location=location.abovebar, color=color.red, text='0.2% Drop', textcolor=color.white, size=size.small)
plotshape(exit_long_condition, style=shape.labeldown, location=location.abovebar, color=color.purple, text='EXIT-LONG', textcolor=color.white, size=size.small)
plotshape(exit_short_condition, style=shape.labelup, location=location.belowbar, color=color.orange, text='EXIT-SHORT', textcolor=color.white, size=size.small)

// Alert conditions for price moves and exits
alertcondition(final_condition_long, title="Price Move > 1.8% After Lower LR Channel Cross", message="Price crossed the lower Linear Regression Channel and moved more than 1.8% in the last 3 minutes!")
alertcondition(final_condition_short, title="Price Drop > 0.2% After Upper LR Channel Cross", message="Price crossed the upper Linear Regression Channel and dropped more than 0.2% in the last 3 minutes!")
alertcondition(exit_long_condition, title="EXIT-LONG: Heikin-Ashi Candle Body Crossing Lower LR Channel", message="The body of a 3-minute Heikin-Ashi candle is crossing outside the lower Linear Regression Channel.")
alertcondition(exit_short_condition, title="EXIT-SHORT: Heikin-Ashi Candle Body Crossing Upper LR Channel", message="The body of a 3-minute Heikin-Ashi candle is crossing outside the upper Linear Regression Channel.")