
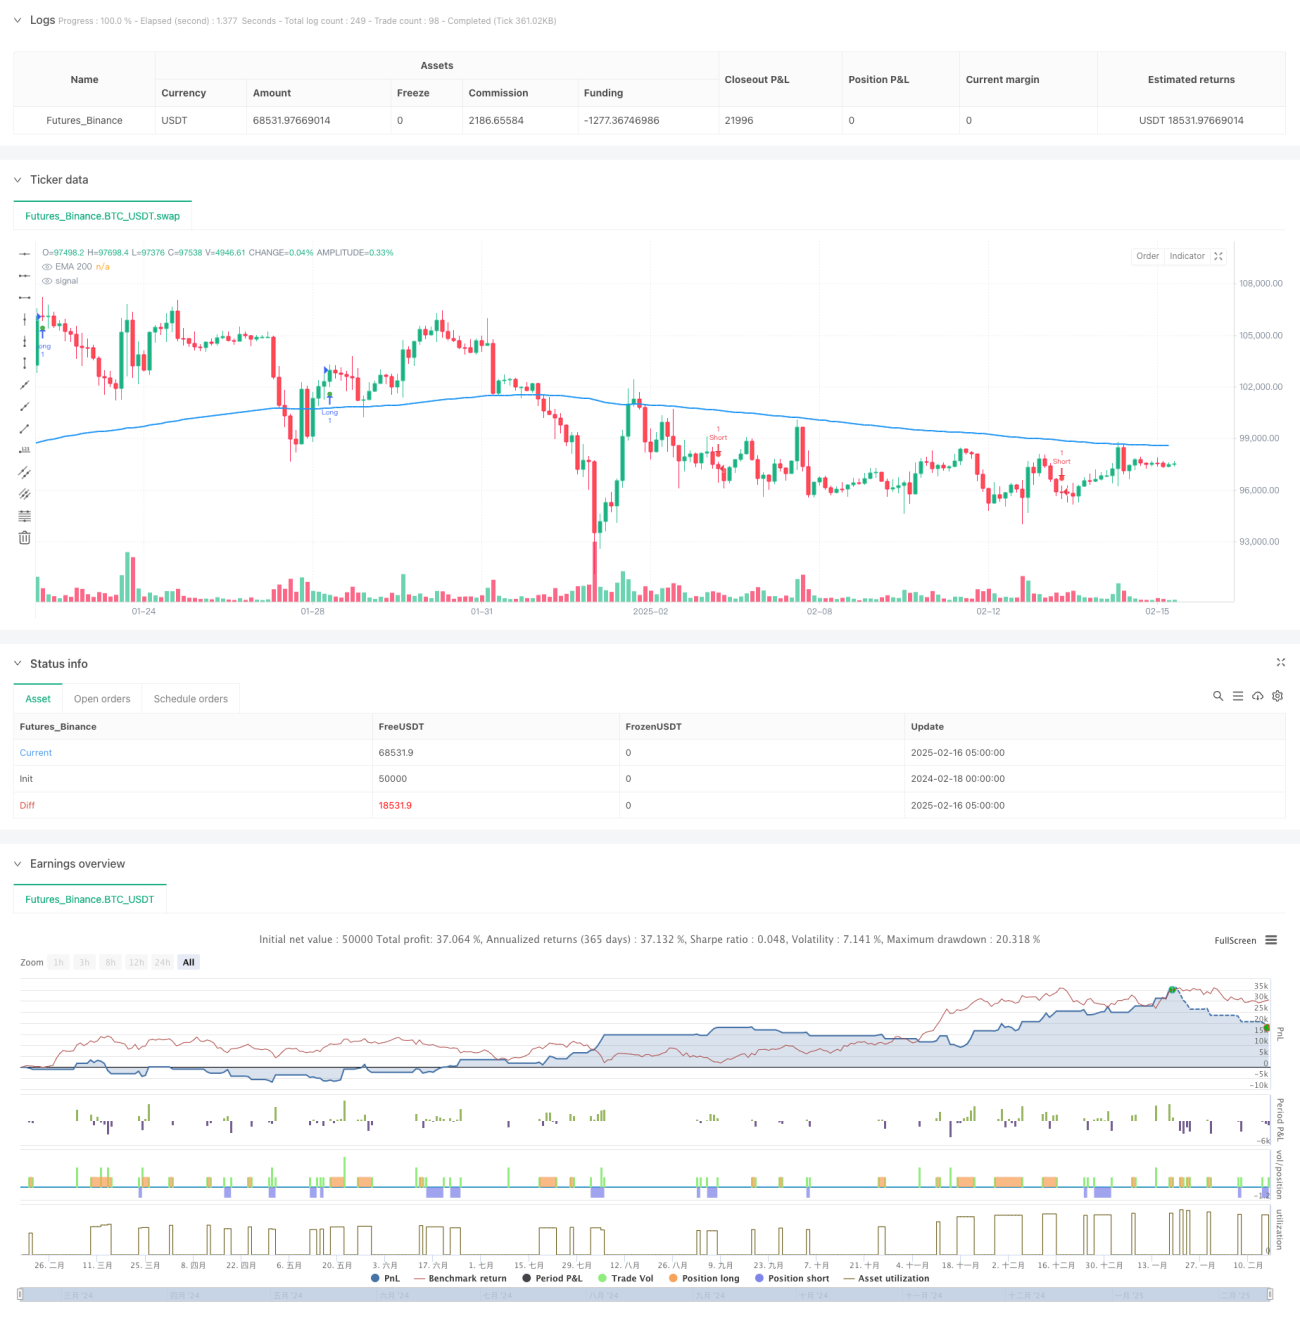
この戦略は,市場における短期的な波動の機会を捕捉するために,動態指標,トレンド指標,波動率指標を組み合わせた複数の技術指標に基づく総合的な取引システムである.この戦略は,MACDの交差信号,EMAのトレンド確認,RSIの超買超売条件とADXのトレンド強さのフィルタリングを通じて取引機会を識別し,ATRベースのダイナミックストップを活用してリスクを管理する.
戦略の中核となるロジックは、次の主要な要素に基づいています。
この戦略は,複数の技術指標を総合的に適用することで,完全な取引システムを構築している.一定の遅れやパラメータ最適化の課題があるにもかかわらず,合理的なリスク管理と継続的な最適化により,戦略は優れた適応性と信頼性を示している.トレーダーは,実用化する前に十分な反省とパラメータ最適化を行うことを推奨している.
/*backtest
start: 2024-02-18 00:00:00
end: 2025-02-16 08:00:00
period: 3h
basePeriod: 3h
exchanges: [{"eid":"Futures_Binance","currency":"BTC_USDT"}]
*/
//@version=5
strategy("Optimized Impulse Wave Strategy", overlay=true)
// === INPUT PARAMETERS ===
fast_length = input(12, title="MACD Fast Length")
slow_length = input(26, title="MACD Slow Length")
signal_smoothing = input(9, title="MACD Signal Smoothing")
ema_length = input(200, title="EMA Length")
rsi_length = input(14, title="RSI Length")
adx_length = input(14, title="ADX Length")
adx_smoothing = input(14, title="ADX Smoothing")
atr_length = input(14, title="ATR Length")
risk_reward_ratio = input(2, title="Risk-Reward Ratio")
adx_threshold = input(20, title="ADX Threshold")
// === INDICATORS ===
[macdLine, signalLine, _] = ta.macd(close, fast_length, slow_length, signal_smoothing)
ema = ta.ema(close, ema_length)
rsi = ta.rsi(close, rsi_length)
[dmiPlus, dmiMinus, adx] = ta.dmi(adx_length, adx_smoothing)
// === ENTRY CONDITIONS ===
bullishTrend = ta.crossover(macdLine, signalLine) and close > ema and adx > adx_threshold and rsi > 50
bearishTrend = ta.crossunder(macdLine, signalLine) and close < ema and adx > adx_threshold and rsi < 50
// === STOP-LOSS & TAKE-PROFIT CALCULATION ===
longStopLoss = close - ta.atr(atr_length) * 1.5
longTakeProfit = close + (ta.atr(atr_length) * 1.5 * risk_reward_ratio)
shortStopLoss = close + ta.atr(atr_length) * 1.5
shortTakeProfit = close - (ta.atr(atr_length) * 1.5 * risk_reward_ratio)
// === STRATEGY EXECUTION ===
// Enter Long
if bullishTrend
strategy.entry("Long", strategy.long)
strategy.exit("TakeProfitLong", from_entry="Long", limit=longTakeProfit, stop=longStopLoss)
// Enter Short
if bearishTrend
strategy.entry("Short", strategy.short)
strategy.exit("TakeProfitShort", from_entry="Short", limit=shortTakeProfit, stop=shortStopLoss)
// === PLOTTING ===
plot(ema, title="EMA 200", color=color.blue, linewidth=2)
plotshape(series=bullishTrend, location=location.belowbar, color=color.green, size=size.small, title="Buy Signal")
plotshape(series=bearishTrend, location=location.abovebar, color=color.red, size=size.small, title="Sell Signal")
// === ALERTS ===
alertcondition(bullishTrend, title="Bullish Entry", message="Buy Signal Triggered!")
alertcondition(bearishTrend, title="Bearish Entry", message="Sell Signal Triggered!")
// === DEBUGGING LOG ===
label.new(bar_index, high, "ADX: " + str.tostring(adx), color=color.white, textcolor=color.black)
label.new(bar_index, low, "MACD Cross: " + str.tostring(macdLine), color=color.white, textcolor=color.black)