移動平均モメンタムハイブリッド取引システム - トレンド継続分析戦略

1
Follow
1781
Followers
概要
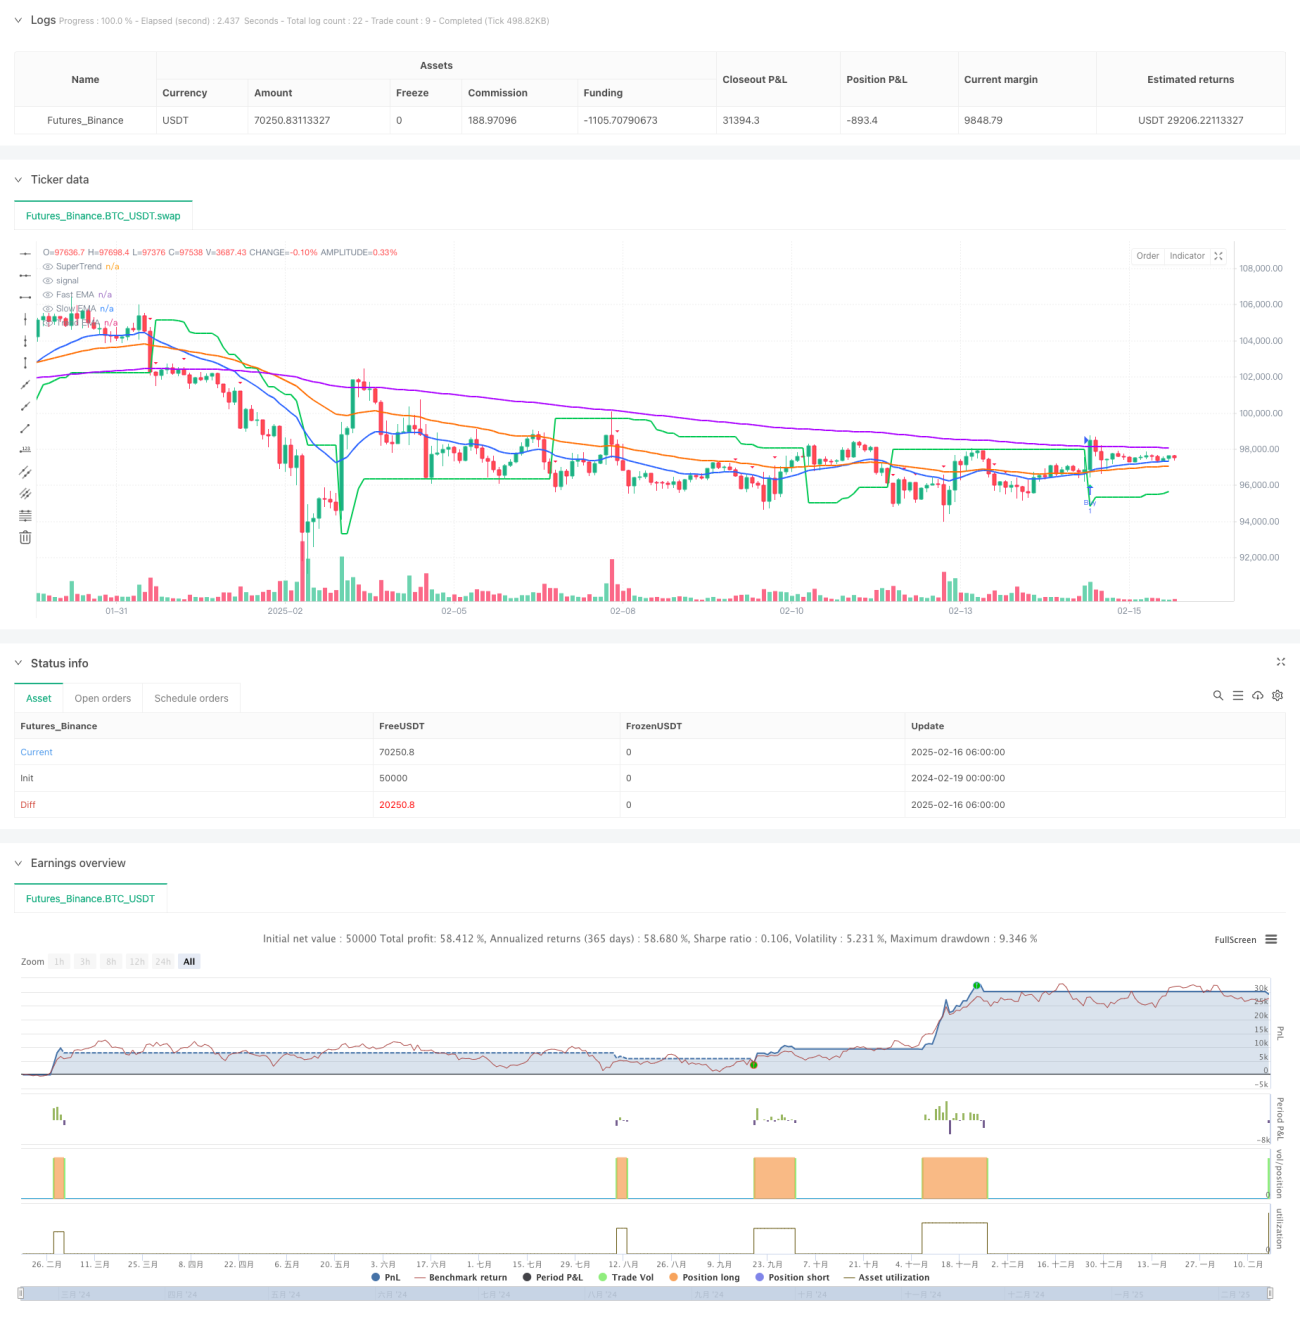
この戦略は,複数の技術指標に基づく混合取引システムで,市場動向を捉えるために平均線 (EMA),相対的に強い指標 (RSI) と超トレンド (SuperTrend) を組み合わせている.この戦略は,2時間周期に特化した固定パラメータの設定を採用し,21/55/200周期均線システムでトレンドを特定し,RSI () の動量フィルターとSuperTrend () の (3,14) ストップを組み合わせてリスクを管理する.この戦略は,取引量の1.5倍の破綻を要求し,ATRによって波動率を確認し,取引の信頼性を高めます.
戦略原則
戦略の核心的な論理は,複数の技術分析の枠組みに基づいています.
- トレンド識別システムは,三重平均線 ((21/55/200周期) を使用し,平均線交差と位置関係によってトレンド方向を判断する
- 動量確認システムは,RSI ((14) の指標を採用し,その均線と組み合わせて偽突破をフィルタリングする
- リスク管理システムは,スーパートレンド指標をダイナミックストップとして統合し,取引の冷却期間を6時間設定します.
- 取引のトリガー条件は,取引量が20サイクル平均の1.5倍以上で,ATRが48サイクル平均より高いことを要求する.
戦略的優位性
- パラメータ最適化:事前に最適化された固定パラメータを使用し,頻繁に調整する必要はありません
- トレンドキャプチャー:複数の技術指標を組み合わせることで,継続的なトレンドを効果的に捉える
- リスク管理:内蔵の取引冷却システムで,過剰取引を防ぐ
- 市場の適応性:波動性の高い市場において優れている
- 取引確認:複数の条件のフィルタリングにより,取引信号の信頼性が向上する
戦略リスク
- 跳躍リスク:24時間取引する市場では,跳躍による損失に直面する可能性があります
- ニュースの影響: 重要なニュースイベントが価格の急激な変動を引き起こし,戦略のパフォーマンスに影響を与える
- ストップダストrigidity: 固定ストップダスト設定は柔軟性がない可能性があります
- 市場環境依存: 市場を整理する際に頻繁に誤信号が生じる可能性
- 滑落リスク:流動性の低い市場では大きな滑落に直面する可能性がある
戦略最適化の方向性
- ダイナミックパラメータ調整:市場の変動率に応じて自動的に調整できるスーパートレンドのパラメータ
- 市場環境認識:市場環境判断モジュールを追加し,異なる市場状態で異なるパラメータ設定を採用する
- ストップ・オプティミゼーション:ダイナミックなストップ・メカニズムを導入し,市場の波動に応じて自律的にストップ・ポジションを調整する
- 取引量分析の強化:取引量分析のより複雑なモデルが追加され,取引信号の精度が向上する
- リスク管理の最適化:市場状況に応じてポジションの保持量を調整するダイナミックポジション管理システムの導入
要約する
この戦略は,複数の技術指標の組み合わせにより,比較的完全な取引システムを構築している.その優点は,市場動向を効果的に捉えることができ,複数の条件のフィルタリングによって取引の信頼性を高めることにある.いくつかの固有のリスクがあるものの,最適化と改善によって,戦略の全体的なパフォーマンスを向上させる余地がある.この戦略は,波動性の高い市場での使用に特に適しているが,市場環境の変化とリスク管理に注意する必要がある.
Source
Pine
Strategy parameters
Related strategies
Comment
All comments (0)
No data
- 1