価格構造に基づく高い比例リターンのブレイクアウト取引戦略

RR SL TP ATH ATL
作成日: 2025-02-18 15:42:01 最終変更日: 2025-02-18 15:42:01
コピー: 1 クリック数: 393
1
フォロー
1617
フォロワー

価格構造に基づく高い比例リターンのブレイクアウト取引戦略

概要

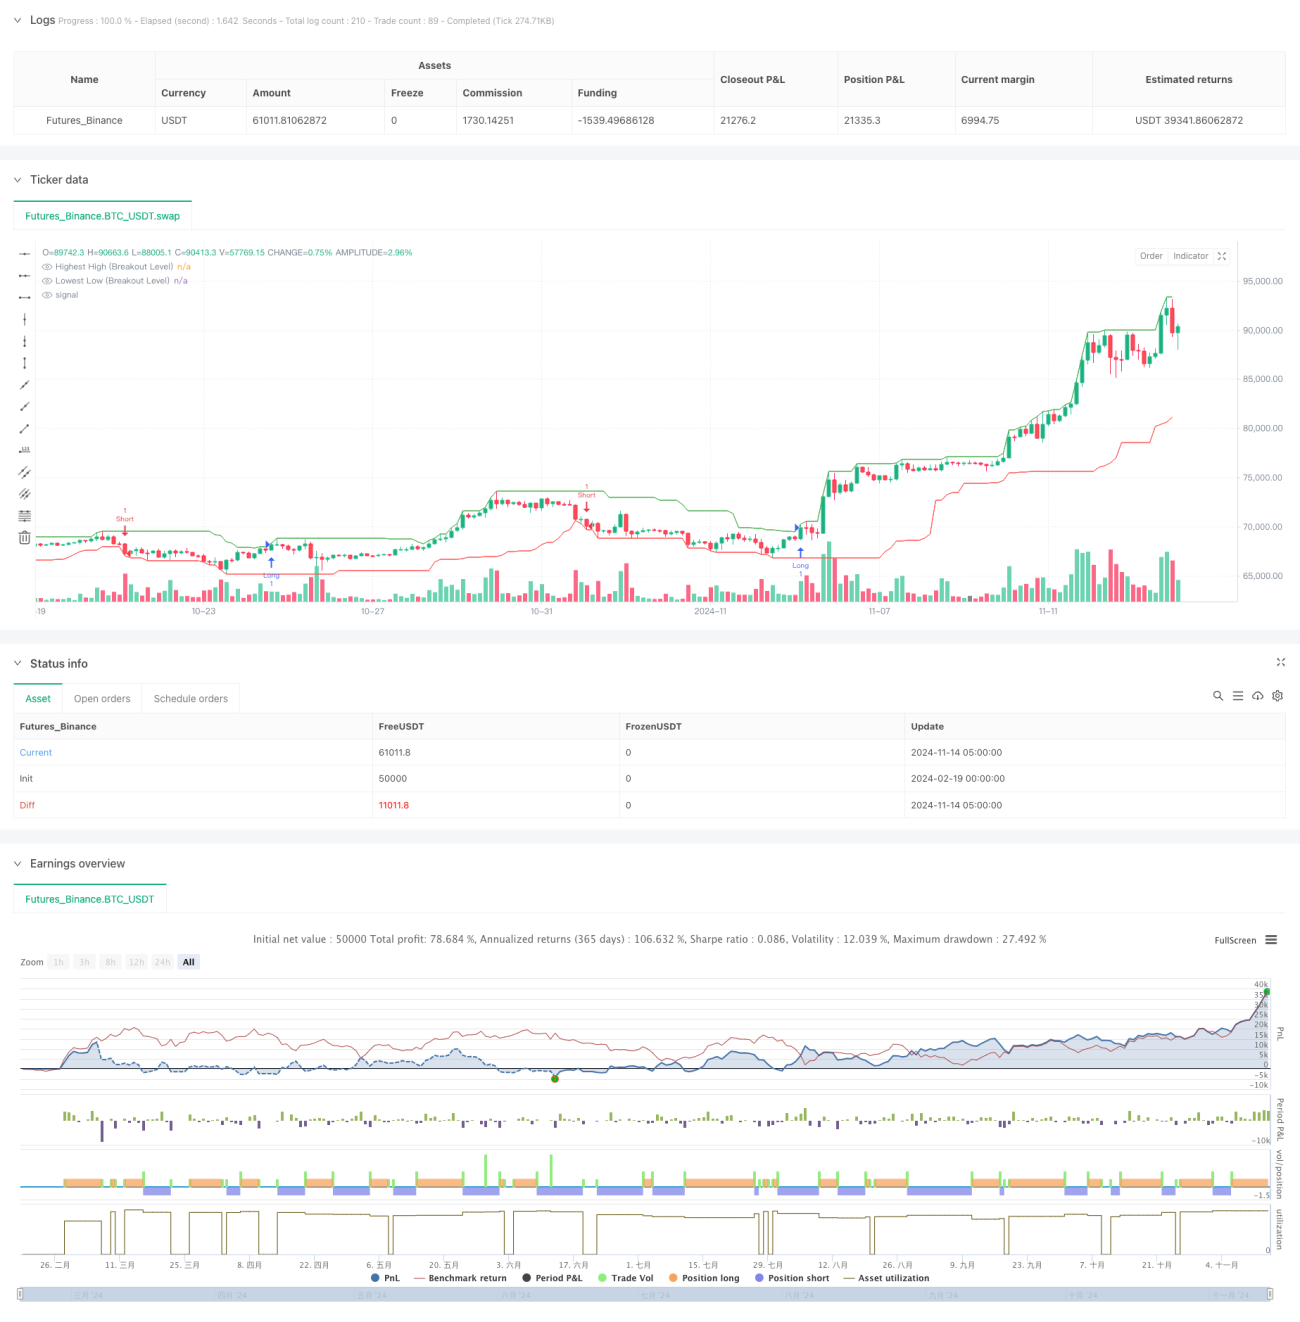
これは,純価格行動に基づく突破取引戦略で,1:5の高リスク・リターン比率で設計されている.この戦略は,重要な価格レベルの突破を特定して取引を行い,市場構造のダイナミックな設定の止損と利益の目標と組み合わせている.この戦略は,いかなる技術指標にも依存せず,完全にリアルタイム価格行動に基づいて取引決定を行う.

戦略原則

戦略の中核となるロジックには、次の主要な部分が含まれます。

  1. 価格の最高値と最低値を遡って識別し,突破基準を形成する
  2. 閉盤価格が前期高点を破るときに多仓を開く,前期低点を破るときに空仓を開く
  3. 近期波動の動的ストップ位置に基づいて,多ポジションは低点でストップし,空ポジションは高点でストップする
  4. 1: 5のリスク・リターン比で計算された収益目標位置
  5. 取引の制限を設定し,過剰な取引を避ける 取引のプロセスは,価格の行動に完全に基づいており,いかなる技術的指標も参照として使用されません.

戦略的優位性

  1. 純価格行動で取引し,指標遅れによる干渉を避ける
  2. リスクとリターン比率の高い設計で,取引ごとに潜在的利益はリスクの5倍
  3. ダイナミックなストップ・ローズ設定,市場構造に応じて自律的に調整
  4. 取引の実行に役立つ明確な取引シグナルとビジュアルマーク
  5. パラメータはさまざまな市場環境に適応できるよう高度に調整可能
  6. 厳格なリスク管理,毎日の取引数制限

戦略リスク

  1. 市場が揺れ動いていると頻繁に偽のブレイクシグナルが生じる可能性
  2. 高リスク・リターン比は,比較的低い勝利率につながる可能性があります.
  3. 突破後のリコールが止損を誘発する
  4. 市場変動の変化が戦略のパフォーマンスに影響する可能性がある
  5. 収益目標を達成するには,大きな価格変動が必要です.

緩和策:

  • この戦略をトレンドマーケットで使う
  • 重要なニュースリリース中に取引を避ける
  • ポジションの規模を合理的に設定する
  • 定期的なチェックと最適化パラメータ

戦略最適化の方向性

  1. トレンドフィルターを追加し,主要トレンドのみで取引する
  2. 取引量確認メカニズムを追加し,突破の信頼性を向上させる
  3. 変動率に動的に調整されたリスク/リターン比率
  4. 複数のタイムサイクル分析を導入し,取引の正確性を向上させる
  5. ストップ・トラッキングなどのスマートなストップ・メカニズムの開発
  6. 市場環境の認識機能を追加し,戦略パラメータの自主調整

要約する

これは,厳格に設計され,論理的に明確な価格行動取引戦略である.高いリスク・報酬比率の設計により,リスクを効果的に制御しながら,有意な利益を追求する.戦略の優位性は,純粋な価格駆動,パラメータの柔軟な調整,リスク制御の完善にある.ある程度の偽突破リスクがあるものの,推奨された最適化の方向によって,戦略の安定性と信頼性をさらに向上させることができる.この戦略は,傾向が明らかな市場環境で使用するのに適しており,トレーダーが取引規律を厳格に遵守することを要求する.

ストラテジーソースコード
/*backtest
start: 2024-02-19 00:00:00
end: 2024-11-14 08:00:00
period: 3h
basePeriod: 3h
exchanges: [{"eid":"Futures_Binance","currency":"BTC_USDT"}]
*/

//@version=6
strategy("Filtered Price Action Breakout", overlay=true)

// === INPUTS ===
lookback = input.int(20, title="Breakout Lookback Period", minval=5)
stopLookback = input.int(10, title="Stop Loss Lookback Period", minval=3)
rrMultiplier = input.float(5.0, title="Risk-to-Reward Multiplier", step=0.1)
maxTradesPerDay = input.int(5, title="Max Trades Per Day", minval=1)

// Ensure there are enough bars for calculations
inRange = bar_index >= lookback

// === CALCULATIONS ===
// Highest high and lowest low over the 'lookback' period
highestHigh = ta.highest(high, lookback)
lowestLow = ta.lowest(low, lookback)

// Define breakout conditions (using previous bar's level)
bullBreakout = ta.crossover(close, highestHigh[1])
bearBreakout = ta.crossunder(close, lowestLow[1])

// Store breakout signals in variables to prevent inconsistencies
bullBreakoutSignal = bullBreakout
bearBreakoutSignal = bearBreakout

// Determine stop levels based on recent swing lows/highs
longStop = ta.lowest(low, stopLookback)
shortStop = ta.highest(high, stopLookback)

// Track number of trades per day (fixing boolean condition issue)
newDay = ta.change(time("D")) != 0
todayTrades = ta.barssince(newDay)
tradeCount = 0
if newDay
    tradeCount := 0
else
    tradeCount := tradeCount + 1

// === STRATEGY LOGIC: ENTRY & EXIT ===
if bullBreakoutSignal and tradeCount < maxTradesPerDay
    entryPrice = close
    stopLevel = longStop
    risk = entryPrice - stopLevel
    if risk > 0
        target = entryPrice + rrMultiplier * risk
        strategy.entry("Long", strategy.long)
        strategy.exit("Long Exit", from_entry="Long", stop=stopLevel, limit=target)
        tradeCount := tradeCount + 1
        
        // // Draw Markups
        // label.new(bar_index, entryPrice, text="Long Entry", color=color.green, textcolor=color.white, size=size.small, style=label.style_label_down)
        // line.new(x1=bar_index, y1=entryPrice, x2=bar_index + 5, y2=entryPrice, color=color.green, width=2)
        // line.new(x1=bar_index, y1=stopLevel, x2=bar_index + 5, y2=stopLevel, color=color.red, width=2, style=line.style_dotted)
        // line.new(x1=bar_index, y1=target, x2=bar_index + 5, y2=target, color=color.blue, width=2, style=line.style_dashed)
        // label.new(bar_index, stopLevel, text="Stop Loss", color=color.red, textcolor=color.white, size=size.small, style=label.style_label_down)
        // label.new(bar_index, target, text="Target", color=color.blue, textcolor=color.white, size=size.small, style=label.style_label_up)

if bearBreakoutSignal and tradeCount < maxTradesPerDay
    entryPrice = close
    stopLevel = shortStop
    risk = stopLevel - entryPrice
    if risk > 0
        target = entryPrice - rrMultiplier * risk
        strategy.entry("Short", strategy.short)
        strategy.exit("Short Exit", from_entry="Short", stop=stopLevel, limit=target)
        tradeCount := tradeCount + 1
        
        // // Draw Markups
        // label.new(bar_index, entryPrice, text="Short Entry", color=color.red, textcolor=color.white, size=size.small, style=label.style_label_up)
        // line.new(x1=bar_index, y1=entryPrice, x2=bar_index + 5, y2=entryPrice, color=color.red, width=2)
        // line.new(x1=bar_index, y1=stopLevel, x2=bar_index + 5, y2=stopLevel, color=color.green, width=2, style=line.style_dotted)
        // line.new(x1=bar_index, y1=target, x2=bar_index + 5, y2=target, color=color.blue, width=2, style=line.style_dashed)
        // label.new(bar_index, stopLevel, text="Stop Loss", color=color.green, textcolor=color.white, size=size.small, style=label.style_label_up)
        // label.new(bar_index, target, text="Target", color=color.blue, textcolor=color.white, size=size.small, style=label.style_label_down)

// === PLOTTING ===
plot(highestHigh, color=color.green, title="Highest High (Breakout Level)")
plot(lowestLow, color=color.red, title="Lowest Low (Breakout Level)")