
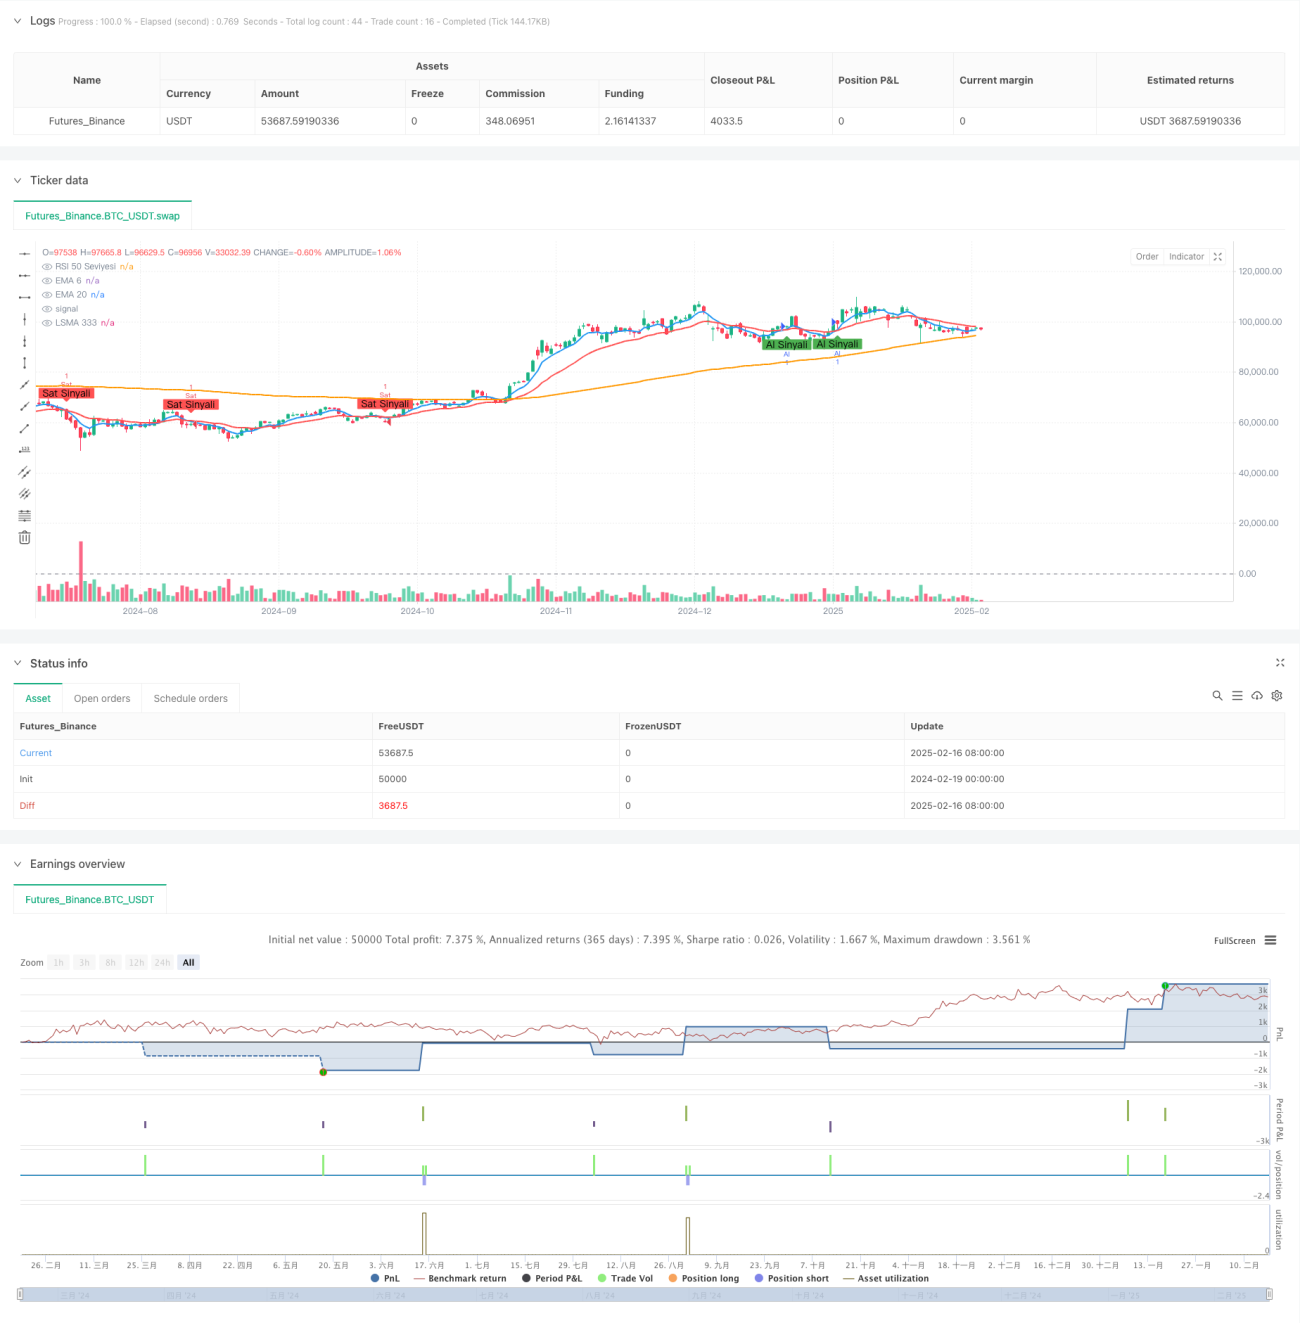
この戦略は,複数の技術指標の交差に基づいたトレンド追跡システムで,EMA (指数移動平均),LSMA (最小二乗移動平均) およびRSI (相対的に強い指標) の3つの指標を組み合わせ,複数のシグナル確認によって取引機会をフィルターします. 戦略は,自己適応のストップ・ロストメカニズムを採用し,市場の動向に応じてリスク管理パラメータを調整できます.
戦略の核心的な論理は以下の通りです.
この戦略は,複数の技術指標の配合による使用により,比較的堅牢なトレンド追跡システムを構築している.戦略の核心的な優位性は,信号確認の信頼性にあるが,同時に,異なる市場環境における適応性の問題にも注意する必要がある.継続的な最適化と改善によって,戦略は,実際の取引でより良いパフォーマンスを期待している.
/*backtest
start: 2024-02-19 00:00:00
end: 2025-02-17 00:00:00
period: 1d
basePeriod: 1d
exchanges: [{"eid":"Futures_Binance","currency":"BTC_USDT"}]
*/
//@version=6
strategy("EMA 6-20 + LSMA 333 + RSI 50 Filtreli Al-Sat Stratejisi", overlay=true)
// Parametreler
emaShortLength = input.int(6, title="Kısa EMA Uzunluğu", minval=1)
emaLongLength = input.int(20, title="Uzun EMA Uzunluğu", minval=1)
lsmaLength = input.int(333, title="LSMA Uzunluğu", minval=1)
rsiLength = input.int(14, title="RSI Uzunluğu", minval=1)
stopLossPerc = input.float(1.0, title="Stop Loss Yüzdesi", minval=0.1)
takeProfitPerc = input.float(2.0, title="Take Profit Yüzdesi", minval=0.1)
// EMA Hesaplamaları
emaShort = ta.ema(close, emaShortLength)
emaLong = ta.ema(close, emaLongLength)
// LSMA Hesaplaması
lsma = ta.linreg(close, lsmaLength, 0)
// RSI Hesaplaması
rsi = ta.rsi(close, rsiLength)
// EMA Kesişimleri
emaCrossUp = ta.crossover(emaShort, emaLong) // EMA 6, EMA 20'nin üzerine çıkarsa
emaCrossDown = ta.crossunder(emaShort, emaLong) // EMA 6, EMA 20'nin altına inerse
// LSMA Filtresi
lsmaFilterBuy = close > lsma // Fiyat LSMA 333'ün üzerinde mi?
lsmaFilterSell = close < lsma // Fiyat LSMA 333'ün altında mı?
// RSI Filtresi
rsiFilterBuy = rsi > 50 // RSI 50'nin üzerinde mi?
rsiFilterSell = rsi < 50 // RSI 50'nin altında mı?
// Alım ve Satım Koşulları
if (emaCrossUp and lsmaFilterBuy and rsiFilterBuy) // EMA 6, EMA 20'nin üzerine çıkarsa VE fiyat LSMA 333'ün üzerindeyse VE RSI 50'nin üzerindeyse
strategy.entry("Al", strategy.long)
strategy.exit("Take Profit/Stop Loss", "Al", stop=close * (1 - stopLossPerc / 100), limit=close * (1 + takeProfitPerc / 100))
if (emaCrossDown and lsmaFilterSell and rsiFilterSell) // EMA 6, EMA 20'nin altına inerse VE fiyat LSMA 333'ün altındaysa VE RSI 50'nin altındaysa
strategy.entry("Sat", strategy.short)
strategy.exit("Take Profit/Stop Loss", "Sat", stop=close * (1 + stopLossPerc / 100), limit=close * (1 - takeProfitPerc / 100))
// EMA, LSMA ve RSI Çizgileri
plot(emaShort, color=color.blue, title="EMA 6", linewidth=2)
plot(emaLong, color=color.red, title="EMA 20", linewidth=2)
plot(lsma, color=color.orange, title="LSMA 333", linewidth=2)
hline(50, "RSI 50 Seviyesi", color=color.gray)
// Kesişim İşaretleri
plotshape(series=emaCrossUp and lsmaFilterBuy and rsiFilterBuy, location=location.belowbar, color=color.green, style=shape.labelup, text="Al Sinyali")
plotshape(series=emaCrossDown and lsmaFilterSell and rsiFilterSell, location=location.abovebar, color=color.red, style=shape.labeldown, text="Sat Sinyali")