複数期間移動平均トレンド判断とRSI買われすぎ戦略

1
Follow
1781
Followers
概要
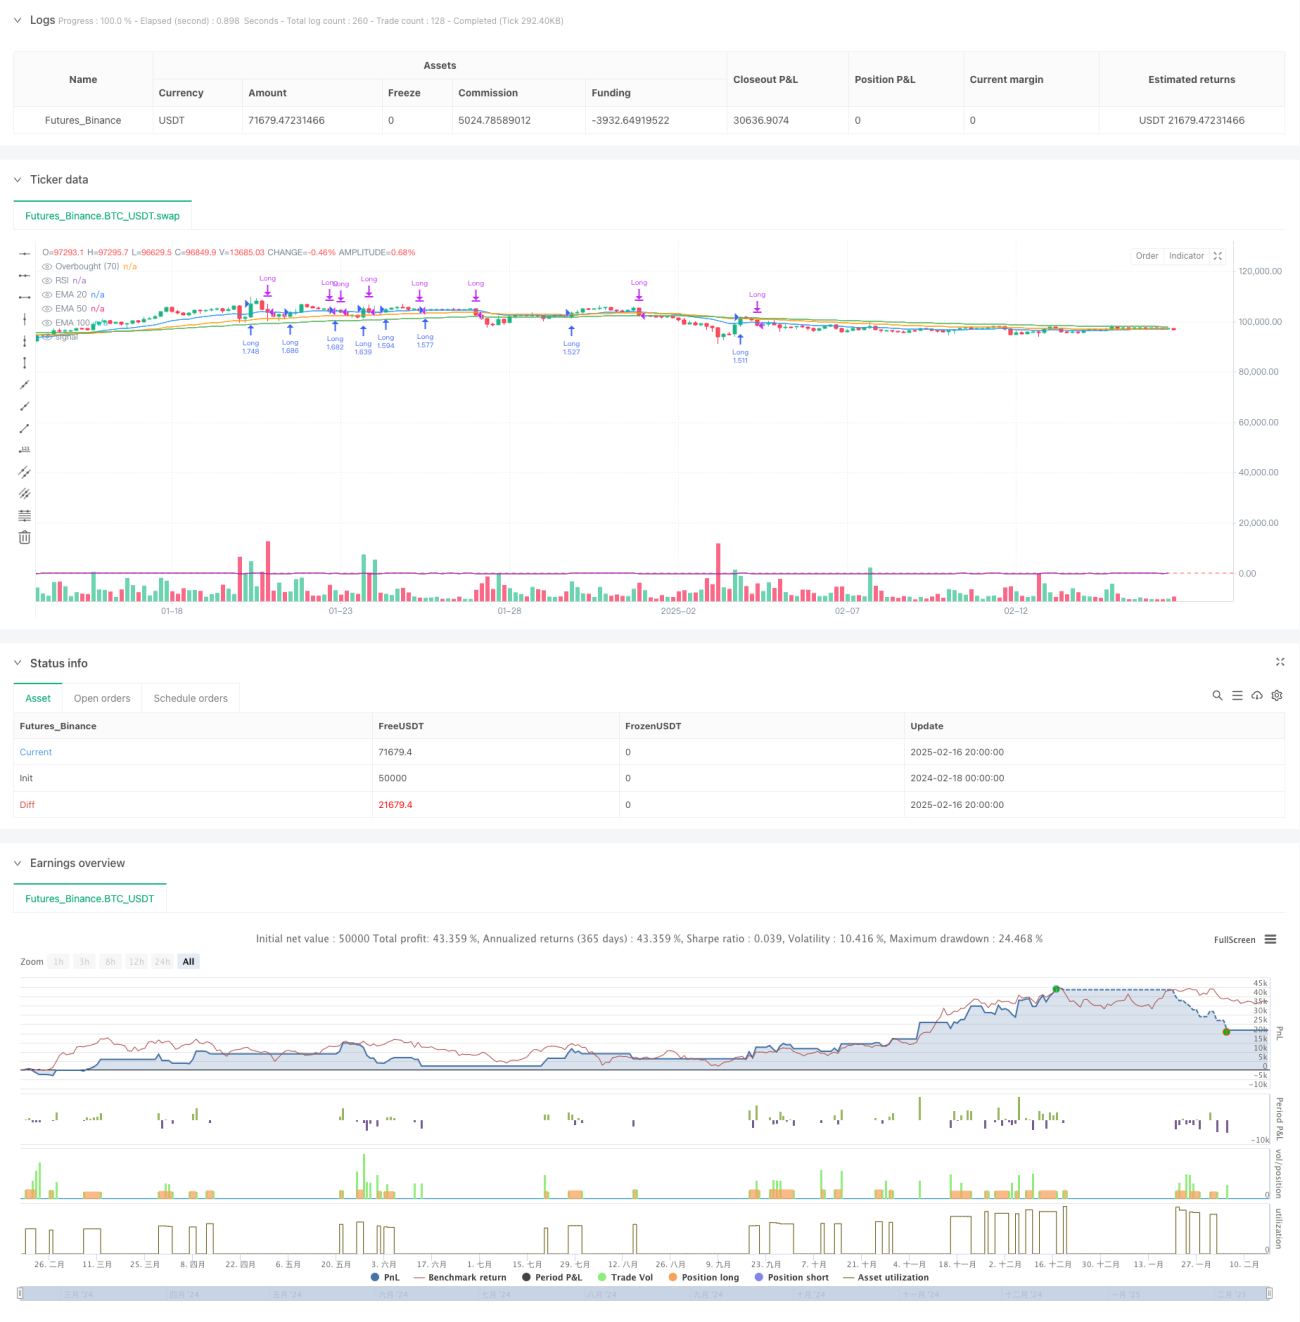
この戦略は,多周期指数移動平均 ((EMA) と相対的に強い指標 ((RSI) に基づくトレンド追跡取引システムである. この戦略は,20,50,100の3周期のEMAトレンドを判断し,価格突破とRSIのオーバーバイシグナルと組み合わせて取引決定を行う. この戦略は,主にトレンド市場に適用され,複数の技術指標の検証によって取引の正確性を向上させる.
戦略原則
戦略の中核となるロジックには、次の主要な部分が含まれます。
- トレンド判断:現在のEMAと前期のEMAを比較して,3期間の平均線 ((20/50/100)) が上昇傾向にあるかどうかを判断する
- エントリー条件:価格が20サイクルEMAを下から突破し,3つの均線が上昇傾向にあるときに買い信号を発信する
- 出口条件:RSIが70を超えたとき (超買い) または価格が20周期EMAを下回ったときの平仓
- ポジション管理:口座総額の割合 (%) を使ってポジションを保持
戦略的優位性
- 複数の確認メカニズム:偽の突破のリスクを低減するために,EMAとRSIの3つの異なる周期で相互検証
- トレンドトラッキング:中長期のトレンドを効果的に捉え,収益性を向上させる
- リスクコントロール:RSIオーバーバイシグナルと平均線下落をストップ条件として使用し,撤回を効果的に制御する
- 資金管理: パーセンテージポジション管理により,口座規模に応じて取引量を自動的に調整できます.
- 体系的な操作: 策略の規則が明確で,主観的な判断による干渉を減らす
戦略リスク
- 遅滞性: EMAは遅滞の指標であり,入場と出場のタイミングがわずかに遅れる可能性があります.
- 振動市場のリスク:横盤振動市場では頻繁に偽信号が生じることがあります.
- 市場が急激に上昇すると,ストップポイントが失効する恐れがある.
- パラメータの感受性:異なる市場環境で,周期的なEMAとRSIの<unk>値の調整が必要になる
- トランザクションコスト: 頻繁に取引すると取引コストが高くなる
戦略最適化の方向性
- 市場環境認識:市場の状況判断メカニズムを追加し,波動的な市場では自動的にポジションを低下させ,または取引を一時停止する
- ダイナミックパラメータ最適化:市場の変動に応じてEMAサイクルとRSIの<unk>値を自動的に調整する
- ストップ・ロスの最適化: トラッキング・ストップ・ロスの導入により,利益の保護
- 入場最適化: 取引量確認メカニズムを増やし,突破信号の信頼性を向上させる
- ポジション管理の最適化:トレンドの強さと市場の変動率の動向に応じてポジション保持率の調整
要約する
これは,トレンド追跡とダイナミクス反転を組み合わせた複合戦略システムである.複数の技術指標の配合使用により,戦略を簡潔かつ分かりやすく保つ一方で,優れたリスク・利益特性を実現している.戦略の核心的な優位性は,厳格なトレンド確認機構と完善したリスク管理システムにあるが,実用的なアプリケーションでは,パラメータ最適化と市場環境の適応性に注意する必要がある.提案された最適化方向によって,戦略はさらに向上する余地がある.
Source
Pine
/*backtest
start: 2024-02-18 00:00:00
end: 2025-02-17 00:00:00
period: 4h
basePeriod: 4h
exchanges: [{"eid":"Futures_Binance","currency":"BTC_USDT"}]
*/

//@version=5
strategy("EMA Crossover + RSI Strategy", overlay=true, initial_capital=10000, default_qty_type=strategy.percent_of_equity, default_qty_value=200)

// Calculate EMAsRelated strategies
Comment
All comments (0)
No data
- 1