
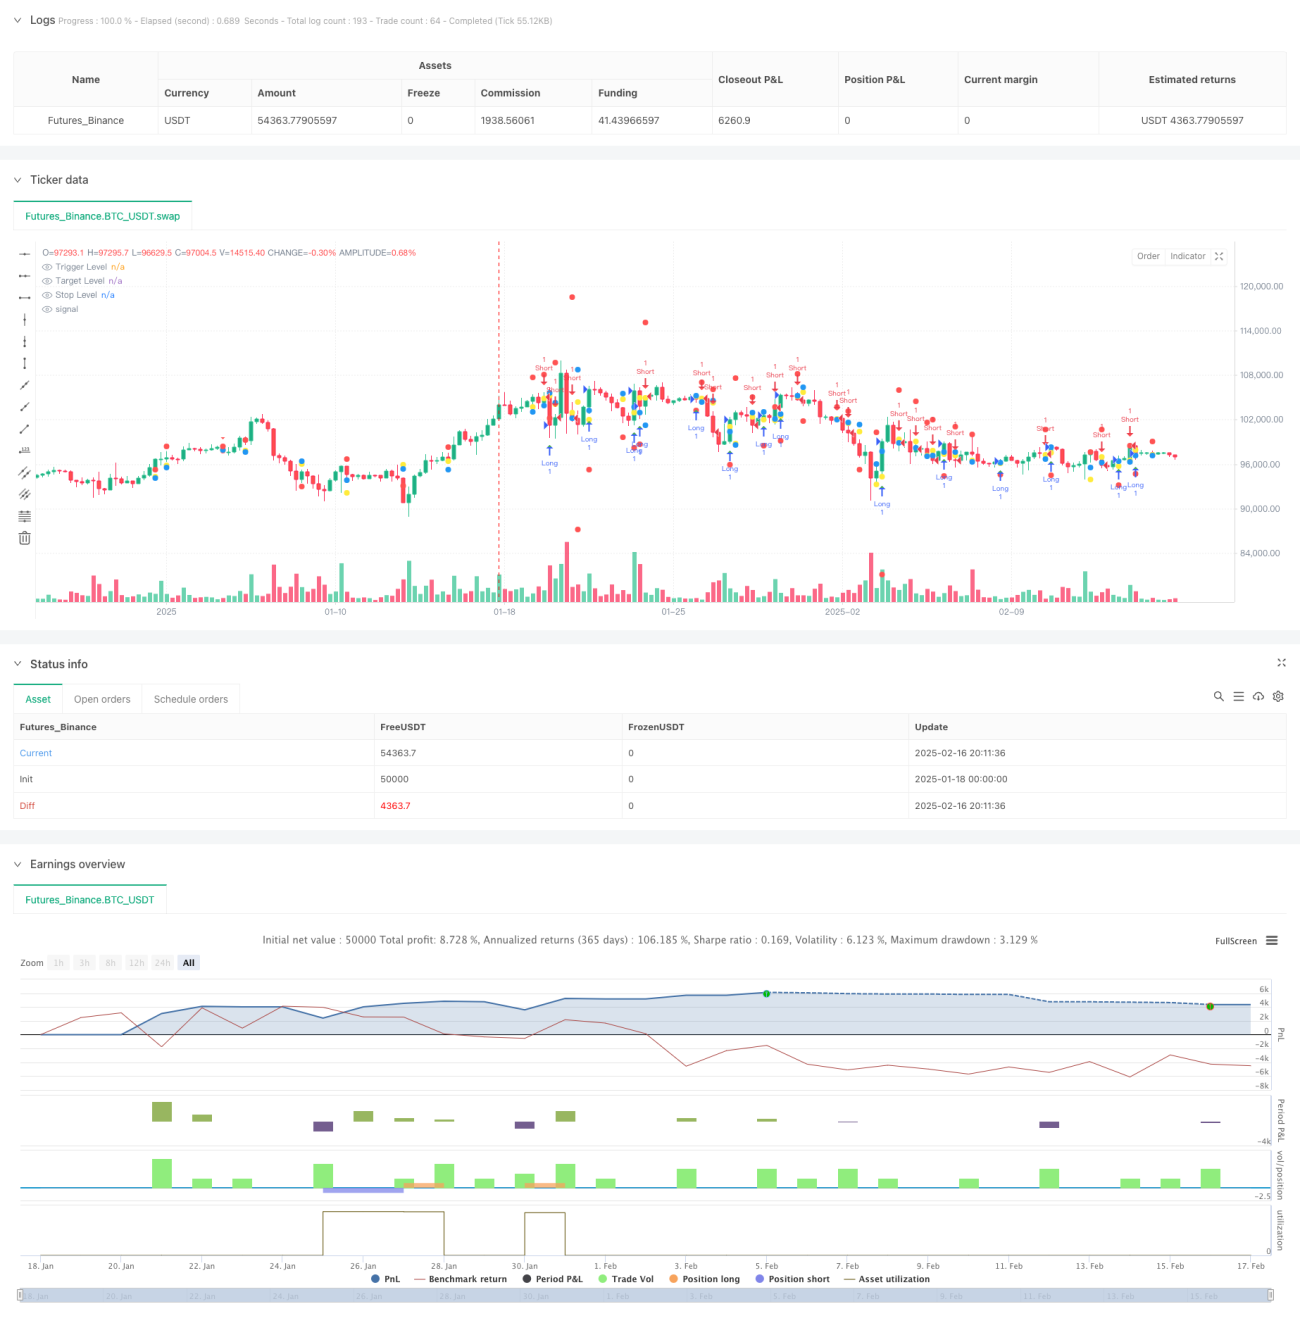
これは,グラフの区間理論に基づく多時間周期取引戦略である.この戦略は,グラフの形状と価格の区間を分析することで,潜在的な取引機会を識別する.この戦略は,取引量フィルターとダイナミック・ストップ・ペアの仕組みを統合し,前期の高低の突破によってトレンドの機会を捉える.
戦略の核心は,価格が前期区間を突破する状況を監視するより高い時間周期 (デフォルトは4時間) です.具体的には:
これは,構造が整った,論理が明確で,複数のタイムサイクルを伴う取引戦略である. リスク管理とフィルタリングの仕組みを統合しながら,より高いタイムサイクルでの価格行動を分析することで,潜在的トレンドの機会を探している. 戦略の核心的な優点は,その適応性と拡張性であり,単純なパラメータ調整で異なる市場環境に適応することができる.
/*backtest
start: 2025-01-18 00:00:00
end: 2025-02-17 00:00:00
period: 6h
basePeriod: 6h
exchanges: [{"eid":"Futures_Binance","currency":"BTC_USDT"}]
*/
//@version=6
strategy("Candle Range Theory Strategy", overlay=true)
// Input parameters
var string HTF = input.timeframe("240", "Higher Timeframe (Minutes)") // 4H default
var float stopLossMultiplier = input.float(1.5, "Stop Loss Multiplier", minval=0.5)
var bool useVolFilter = input.bool(false, "Use Volume Filter")
var float volThreshold = input.float(1.5, "Volume Threshold Multiplier", minval=1.0)
// Function to get higher timeframe data
getHtfData(src) =>
request.security(syminfo.tickerid, HTF, src)
// Calculate volume condition once per bar
var bool volCondition = true
if useVolFilter
float vol = getHtfData(volume)
float avgVol = ta.sma(vol, 20)
volCondition := vol > avgVol * volThreshold
// Get HTF candle data
htf_open = getHtfData(open)
htf_high = getHtfData(high)
htf_low = getHtfData(low)
htf_close = getHtfData(close)
// Store previous candle data
var float h1 = na // High of Candle 1
var float l1 = na // Low of Candle 1
var float h2 = na // High of Candle 2
var float l2 = na // Low of Candle 2
var float prevClose = na
// Track setup conditions
var string setupType = na
var float triggerLevel = na
var float targetLevel = na
var float stopLevel = na
// Update candle data - fixed time function usage
var bool isNewBar = false
isNewBar := ta.change(request.security(syminfo.tickerid, HTF, time)) != 0
if isNewBar
h1 := h2
l1 := l2
h2 := htf_high[1]
l2 := htf_low[1]
prevClose := htf_close[1]
// Identify setup conditions
if not na(h1) and not na(h2) and not na(prevClose)
if (h2 > h1 and prevClose < h1) // Short setup
setupType := "short"
triggerLevel := l2
targetLevel := l1
stopLevel := h2 + (h2 - l1) * stopLossMultiplier
else if (l2 < l1 and prevClose > l1) // Long setup
setupType := "long"
triggerLevel := h2
targetLevel := h1
stopLevel := l2 - (h1 - l2) * stopLossMultiplier
else
setupType := na
triggerLevel := na
targetLevel := na
stopLevel := na
// Entry conditions using pre-calculated volume condition - fixed line breaks
bool longCondition = setupType == "long" and high > triggerLevel and not na(triggerLevel) and volCondition
bool shortCondition = setupType == "short" and low < triggerLevel and not na(triggerLevel) and volCondition
// Execute trades
if longCondition
strategy.entry("Long", strategy.long, comment="Long Entry")
strategy.exit("Long Exit", "Long", limit=targetLevel, stop=stopLevel)
if shortCondition
strategy.entry("Short", strategy.short, comment="Short Entry")
strategy.exit("Short Exit", "Short", limit=targetLevel, stop=stopLevel)
// Plot signals - fixed plotshape parameters
plotshape(series=longCondition, title="Long Signal", location=location.belowbar, color=color.green, style=shape.triangleup)
plotshape(series=shortCondition, title="Short Signal", location=location.abovebar, color=color.red, style=shape.triangledown)
plot(triggerLevel, "Trigger Level", color=color.yellow, style=plot.style_circles)
plot(targetLevel, "Target Level", color=color.blue, style=plot.style_circles)
plot(stopLevel, "Stop Level", color=color.red, style=plot.style_circles)